A “frustrated consumer cuts spending” headline is easy to write about a negative retail sales month. July 2026 had one. The better question is why it happened.
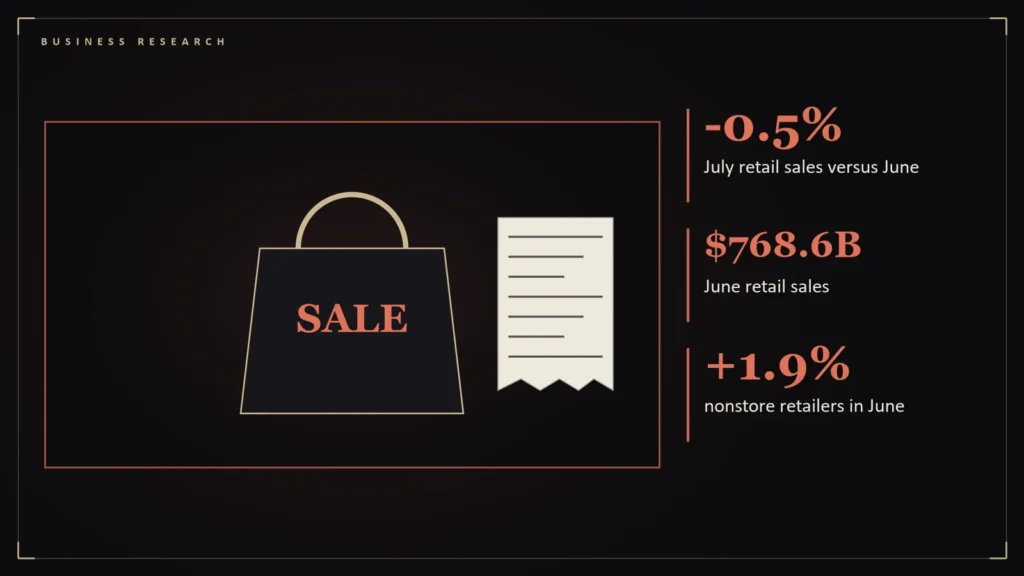
- June retail sales totaled $768.6 billion, up 0.2 percent from May and 6.7 percent year over year; nonstore retailers jumped 1.9 percent on Amazon’s June 23-26 Prime Day [1].
- July sales fell 0.5 percent from June in revised Census data (first reported as −0.6 percent) [2].
- Pulling demand forward into late June creates an arithmetic problem for July, since households do not immediately repurchase [1].
- The monthly figure is a noisy signal; the three-month trend was still up 6.0 percent from a year earlier [2].
The base effect from June
June retail and food services sales were $768.6 billion, up 0.2 percent from May and 6.7 percent from a year earlier. Nonstore retailers jumped 1.9 percent, helped by Amazon’s Prime Day, held June 23 to 26 [1]. As one analysis put it, pulling demand forward into late June creates an arithmetic problem for July, because households that bought early do not buy again right away [1].
What July showed
Census Bureau data show July sales fell 0.5 percent from June, a figure revised from an initial decline of 0.6 percent [2]. The shape is the classic payback: an event-driven jump followed by a dip.
Why one month is not a trend
The Census Bureau reports a margin of error of about 0.4 percentage points on a monthly change like August’s, so a decline of half a percent sits close to the edge of statistical noise [2]. And the broader trend is firm: for the three months from June through August, total sales were up 6.0 percent from the same period a year earlier [2].
The shadow of tariffs
Households and retailers also had a date in mind. New 50 percent duties on roughly $20 billion of Canadian goods were due on August 19, which gave the July report a particular significance as the last major reading before the change [1]. Pull-forward buying ahead of tariffs, as well as events like Prime Day, can bend monthly data in either direction.
The bar analysts had set for July
Analysts previewing July sales set thresholds: above +0.6 percent on the month would show strong resilience, +0.2 to +0.5 percent would indicate a continuing trend, and flat or negative (excluding gasoline price effects) would signal demand concern [1]. A reading of −0.5 percent therefore fell in the lowest bracket, although the Prime Day timing gives a plausible reason for much of it. June’s base was high: sales of $768.6 billion rose 0.2 percent on the month (with a margin of plus or minus 0.4 points) and 6.7 percent on the year, and the control group, which excludes autos, gas, building materials and food services, rose 0.5 percent [1].
The category detail from June shows how the pull-forward worked: motor vehicles rose 1.9 percent, nonstore retailers also 1.9 percent with Amazon’s Prime Day on June 23 to 26, gasoline stations fell 5.3 percent and food services rose 0.1 percent [1]. Price data from July supply the other half of the story: headline CPI rose 0.1 percent on the month and 3.4 percent on the year, with gasoline down 2.9 percent on the month but up 24.6 percent over twelve months [1]. Lower gas prices in July can lower retail sales without any change in how many things people buy.
How to read the dip
A one-month drop of 0.5 percent after an event month does not show a consumer retreat. A series of declines would. August brought a 1.2 percent rebound [2]. The right posture is to watch the trend, not the month. This is analysis, not investment advice.
Questions readers ask
Did retail sales fall in July 2026?
Yes: they fell 0.5 percent from June in revised Census data, after a Prime Day-boosted June [1][2].
Did sales recover in August?
Yes, retail and food services sales rose 1.2 percent in August to $773.9 billion [2].
References
- US July Retail Sales, August 14: What to Watch — Shopappy — https://shopappy.com/news/industry-news/us-july-retail-sales-august-14
- Advance Monthly Retail Trade Report — U.S. Census Bureau — https://www.census.gov/retail/sales.html