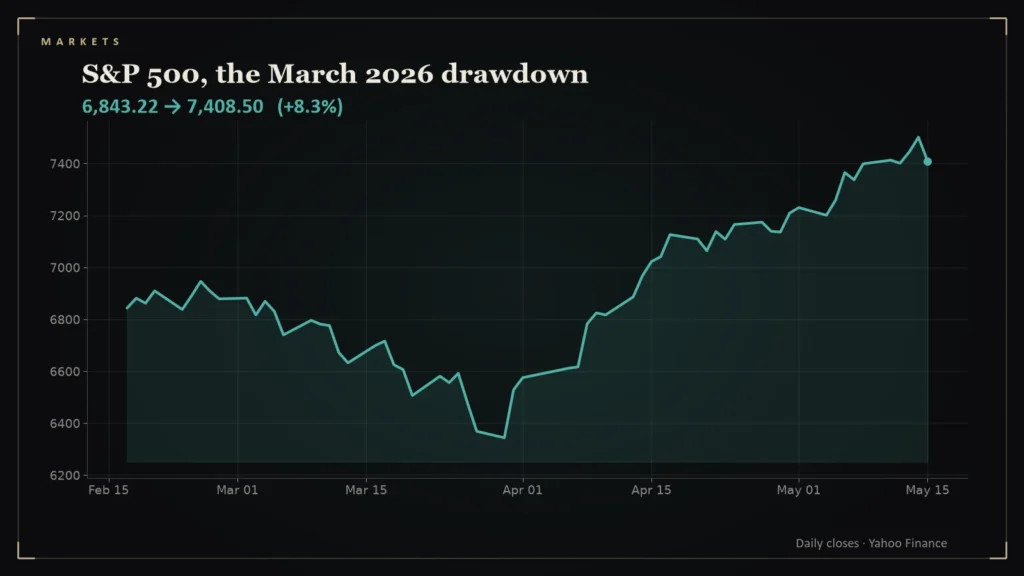
The March 2026 sell-off felt like a crisis while it was happening: a war, an oil spike, a fear index above 30. The price data say something quieter. It was a pullback, a sharp one, and it fell short of the 10 percent that traders call a correction.
- The S&P 500’s 2026 peak before the March low was 6,978.60 on January 27; the March 30 low was 6,343.72, a decline of about 9.1 percent [1].
- From the last close before the war began, February 27 at 6,878.88, the fall to the low was about 7.8 percent [1][2].
- The VIX peaked at 31.05 on March 27 [3].
- From the March 30 low to October 2, the index rose about 21.7 percent, and it set a 2026 high of 7,798.99 on August 13 [1].
The measured decline
Yahoo Finance data show the S&P 500 reaching 6,978.60 on January 27, 2026, the high before the spring decline, and bottoming at 6,343.72 on March 30. That is a drop of about 9.1 percent from peak to trough [1]. Measured from February 27, the final close before the U.S. and Israel struck Iran on February 28, the index stood at 6,878.88, so the war-driven slide was roughly 7.8 percent [1][2].
Fear, quantified
The VIX, which measures expected 30-day volatility from options prices, reached 31.05 on March 27, the highest of the year and a level usually described as stressed [3]. By October 2 it had fallen to 15.31, below its long-run average and close to its 2026 low of 14.21 on September 22 [3].
The recovery
The index gained about 21.7 percent from the March 30 low to its October 2 close of 7,722.72, and set a 2026 high of 7,798.99 on August 13 [1]. For the year it is up about 12.8 percent [1]. The market recovered the entire pullback within months, even as Brent crude stayed far above its January level [4].
How long the recovery took
The recovery can be dated. The S&P 500 first closed above its pre-war level of 6,878.88, the February 27 close, on April 13, which was 9 trading days after the March 30 low [1]. It first closed above the January 27 peak of 6,978.60 on April 15 [1]. Counting sessions after the January peak and before that date, the index closed below the peak on 32 of them, which is how long investors sat “underwater” relative to the high (my calculation from daily closes) [1].
A drawdown of about nine percent is within the ordinary range for equity markets, and the timeline shows why the label “pullback” fits better than “crash.” The decline took about two months to unfold from the January high, the VIX peaked at 31.05 and then faded, and the recovery was steady rather than instant [1][3]. Oil’s timing is notable: Brent reached its March high just as the index bottomed [4]. What the numbers cannot say is whether the next shock will resolve as quickly.
What to take from it
First, size matters when judging a headline: a “market rout” of 9 percent is a very different thing from 30 percent. Second, markets can recover quickly from a shock if earnings hold up, and second-quarter S&P 500 earnings were strong [5]. Third, the recovery does not make the underlying cause go away; oil is above $100 again and the Fed has raised rates. This is analysis, not investment advice.
Questions readers ask
How far did the S&P 500 fall in March 2026?
About 9.1 percent from its January 27 high to its March 30 low, according to Yahoo Finance data [1].
Was it a correction?
By the common definition of a 10 percent decline, no; the peak-to-trough drop was about 9.1 percent [1].
References
- S&P 500 (^GSPC) Historical Prices — Yahoo Finance — https://finance.yahoo.com/quote/%5EGSPC/history/
- Oil stays above $100 a barrel amid Iran's stranglehold on Strait of Hormuz — Al Jazeera — https://www.aljazeera.com/amp/economy/2026/3/13/oil-stays-above-100-a-barrel-amid-irans-stranglehold-on-strait-of-hormuz
- CBOE Volatility Index (^VIX) Historical Prices — Yahoo Finance — https://finance.yahoo.com/quote/%5EVIX/history/
- Brent Crude Oil (BZ=F) Historical Prices — Yahoo Finance — https://finance.yahoo.com/quote/BZ%3DF/history/
- S&P 500 Earnings Season Update, August 7, 2026 — FactSet — https://insight.factset.com/sp-500-earnings-season-update-august-7-2026