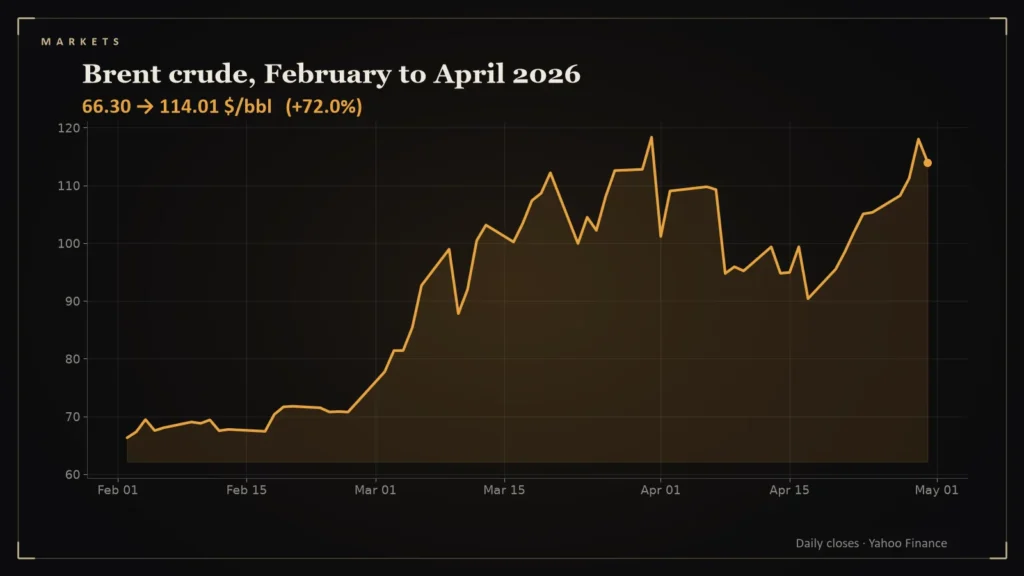
Markets do not fall in a straight line. They fall in a month with a story, and for 2026 the story was March: a war, a closed shipping lane, and an oil price that rewrote everyone’s forecasts.
- The S&P 500 hit its 2026 low of 6,343.72 on March 30; it closed at 7,722.72 on October 2, about 22 percent higher than that low [1].
- The VIX volatility index peaked at 31.05 on March 27 [2].
- Brent crude reached its 2026 high of $118.35 on March 31, up from about $60 on January 7 [3].
- The war began February 28; by March 13 Brent was $101.13 and Hormuz shipping had nearly halted, per Al Jazeera [4].
The bottom, in numbers
According to Yahoo Finance data, the S&P 500 hit its low for the year, 6,343.72, on March 30. The Dow’s low came three days earlier, on March 27, at 45,166.64, and the Nasdaq Composite bottomed at 20,794.64 on March 30 [1]. The VIX, the market’s fear gauge, reached 31.05 on March 27, its highest level of the year [2].
The cause: oil
Brent crude, near $60 on January 7, hit $118.35 on March 31, the 2026 peak [3]. The U.S. and Israel launched joint strikes on Iran on February 28. By March 13, with the war about two weeks old, Brent was $101.13 and Strait of Hormuz traffic had nearly halted, down from an average of 138 transits a day before the conflict; the International Energy Agency’s release of 400 million barrels from emergency reserves did not significantly calm prices [4]. The strait handles roughly a fifth of global seaborne petroleum trade [5].
The rebound
From the March 30 low to October 2, the S&P 500 gained about 21.7 percent, closing at 7,722.72, with a 2026 high of 7,798.99 on August 13 [1]. The Nasdaq Composite rose even more, from 20,794.64 to 27,190.86 [1]. The VIX settled back to 15.31 by October 2 [2].
The daily detail
The month is easier to feel in daily moves than in its low point. Between the February 27 close and March 31, the S&P 500 had 22 sessions, and 14 of them were declines [1]. The worst single day was -1.7 percent on March 26, and the best was +2.9 percent on March 31 [1]. From the February 27 close of 6,878.88 to the March 30 low of 6,343.72, the index fell 7.8 percent [1].
Fear stayed elevated for weeks rather than days. The VIX closed at or above 25 on 13 of the 22 trading days in March [2], and Brent rose from 72.48 dollars a barrel at the end of February to 118.35 at the end of March, a gain of 63 percent [3]. Those counts are my calculation from daily closes. They show a market under sustained pressure from an energy shock, not a single bad session.
What the episode shows
An energy shock hit markets hard and fast, and then markets looked through it, helped by strong corporate earnings (second-quarter S&P 500 earnings growth was about 50 percent, with 86 percent of companies beating estimates, per FactSet [6]). That does not mean the shock has passed: Brent is back above $100 and the Fed has raised rates.
The lesson from March is the standard one: a scary month and a good year can coexist, and the speed of a rebound says little about how safe the next fall will be. This is analysis, not investment advice.
Questions readers ask
When did the S&P 500 hit its 2026 low?
March 30, 2026, at 6,343.72, according to Yahoo Finance price history [1].
How high did Brent crude go in 2026?
Brent reached $118.35 on March 31, its 2026 high in the data used here [3].
References
- S&P 500 (^GSPC) Historical Prices — Yahoo Finance — https://finance.yahoo.com/quote/%5EGSPC/history/
- CBOE Volatility Index (^VIX) Historical Prices — Yahoo Finance — https://finance.yahoo.com/quote/%5EVIX/history/
- Brent Crude Oil (BZ=F) Historical Prices — Yahoo Finance — https://finance.yahoo.com/quote/BZ%3DF/history/
- Oil stays above $100 a barrel amid Iran's stranglehold on Strait of Hormuz — Al Jazeera — https://www.aljazeera.com/amp/economy/2026/3/13/oil-stays-above-100-a-barrel-amid-irans-stranglehold-on-strait-of-hormuz
- Brent climbs past $100 as US-Iran clashes in Strait of Hormuz reignite global energy fears — Business Today — https://www.businesstoday.in/world/story/brent-climbs-past-100-as-us-iran-clashes-in-strait-of-hormuz-reignite-global-energy-fears-554426-2026-09-10
- S&P 500 Earnings Season Update, August 7, 2026 — FactSet — https://insight.factset.com/sp-500-earnings-season-update-august-7-2026