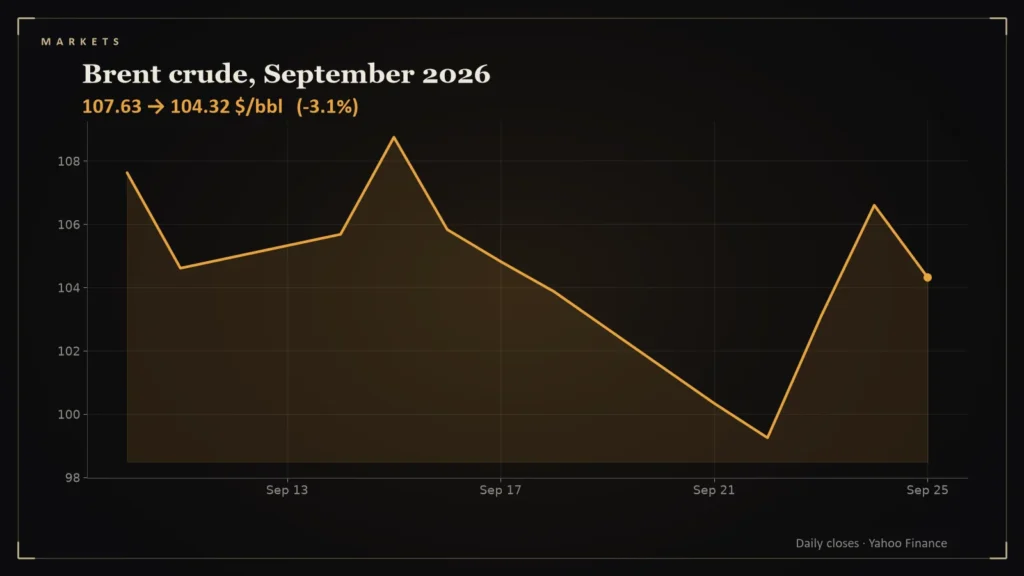
A boat that ends the day where it started has still been sailing. Brent crude did exactly that in the week of September 21: it finished within a few dollars of its starting price after a trip through a 7.4% range.
- Brent futures closed at 103.87 dollars a barrel on September 18 and 104.32 on September 25, a net change of +0.43% [1].
- The low close was 99.25 on September 22 and the high close 106.60 on September 24, a spread of 7.4% [1].
- On a 1,000-barrel position, the low-to-high spread is $7,350.
- WTI, the U.S. benchmark, closed at 92.41 on September 25 [2].
The path
Brent closed at 103.87 on Friday, September 18. It fell to 100.34 on Monday and 99.25 on Tuesday, the week’s low close. It then rose to 103.08 on Wednesday and 106.60 on Thursday, the high close, before easing to 104.32 on Friday [1]. The net change from one Friday to the next was +0.43%.
Why the net hides the story
A weekly percentage change compares two points and ignores the road between them. Here the low-to-high swing was 7.35 dollars a barrel, or 7.4%. For a refiner, an airline or a trader holding a position, the path matters as much as the destination, because hedges and margin calls respond to the daily price.
What a barrel means to a motorist
A barrel holds 42 U.S. gallons. A dollar change in a barrel therefore works out to roughly 2.4 cents per gallon of crude cost, before refining, distribution and taxes. The week’s 7.35-dollar spread is about 17 cents per gallon of crude cost, a figure that pump prices only partly pass through and with a lag.
A volatile year for one benchmark
Seen against the rest of 2026, the week was busy but not unprecedented. Of 184 daily Brent changes from January 2 to September 25, 72 were 3 percent or larger in either direction, about 39 percent of sessions [1]. The biggest single move of the week of September 21 was +3.9% on September 23 [1]. The annualised volatility of Brent’s daily changes over 2026 to date is about 61 percent, a figure that means the price typically moves by that much over a year in either direction on a one-standard-deviation basis [1].
Compare that with the WTI series: WTI closed at 92.41 on September 25 and Brent at 104.32, a gap of 11.91 dollars a barrel [1][2]. The gap between the two benchmarks reflects location and grade, and it can widen or narrow. These statistics are my calculation from continuous futures series, so contract rolls can add or remove a few jumps.
Limits
- Brent futures differ from physical cargoes. The series here is the front-month contract on Yahoo Finance.
- Contract rolls can distort. A switch between months can change the price series without any change in the market.
- No cause is asserted. The data shows the swings, not the reasons for them.
Prices are daily closes from Yahoo Finance historical data. WTI is the U.S. benchmark and is shown for comparison.
Questions readers ask
How much did Brent change over the week of September 21?
It ended the week +0.43% from the prior Friday, but its closes ranged from 99.25 to 106.60 [1].
How does a change in crude oil prices affect gasoline?
A barrel holds 42 gallons, so a one-dollar change is about 2.4 cents per gallon of crude cost before refining, distribution and taxes, and pump prices adjust with a lag.
References
- Brent Crude Oil Futures (BZ=F) Historical Data, Yahoo Finance — https://finance.yahoo.com/quote/BZ%3DF/history/
- WTI Crude Oil Futures (CL=F) Historical Data, Yahoo Finance — https://finance.yahoo.com/quote/CL%3DF/history/