Bitcoin behaves like a weather vane in a gale: it turns hard when the wind shifts, and it keeps turning when the stock market is shut. The week of September 14 gave a tidy example.
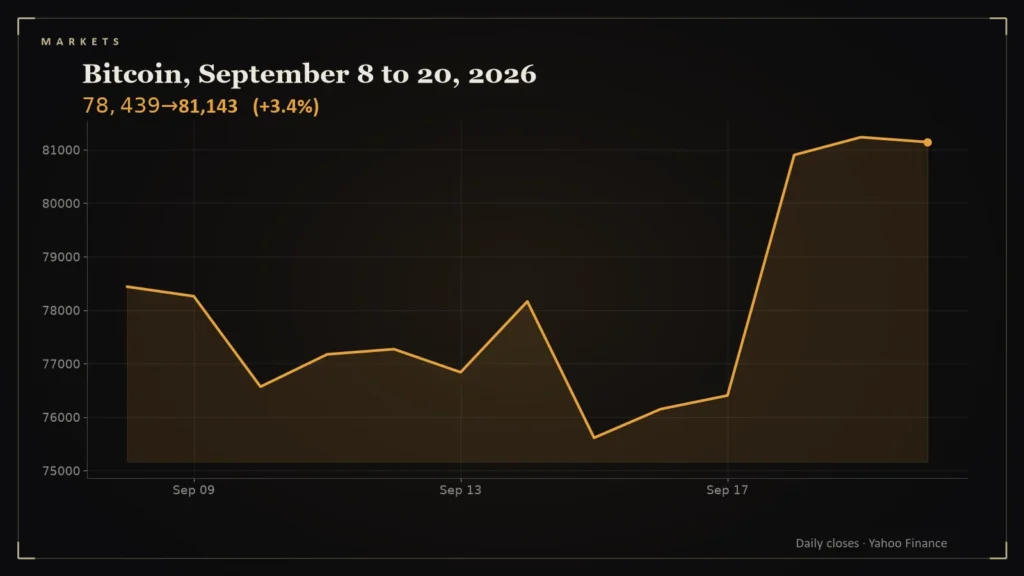
- Bitcoin closed at $75,613 on September 15 and $81,143 on September 20, a gain of 7.3% [1].
- Most of the gain came in one day: September 18, when bitcoin rose from $76,404 to $80,901 (+5.89%) [1].
- The S&P 500 changed only -0.08% over the week ended September 18 [2].
- Bitcoin trades every day of the week, so its weekend closes have no stock-market counterpart.
The numbers
Bitcoin closed at $78,163 on Monday, September 14. It dipped to $75,613 on Tuesday, then climbed to $76,404 on Thursday and jumped to $80,901 on Friday. By Sunday it closed at $81,143 [1]. From Tuesday’s close to Sunday’s, that is 7.3%. From Monday’s close, it is 3.8%.
One day did most of the work
Friday, September 18 accounts for $4,498 of the climb, a one-day move of 5.9% [1]. This is typical of the asset: long quiet stretches punctuated by single large days. A sceptic would call it fragile, an enthusiast would call it a coiled spring, and the price history supports either reading.
Against the stock market
Over September 11 to 18, the S&P 500 changed -0.08% [2]. That contrast, a calm index next to a large bitcoin move, is a reminder that the two do not always travel together. Bitcoin’s own daily swings over this week ran 3.3% down to 5.9% up on weekday closes.
Putting a six percent week in context
Bitcoin rose 5.6% over the seven days to September 20 [1]. To judge that, I compared it with every rolling seven-day change in the daily series since October 2024, 710 windows in all. Only 109 of them were as large or larger, and 123 windows (17 percent) gained 5 percent or more. In other words, a week like this one is a good week, but the asset has had hundreds of comparable ones.
How closely does it track stocks? Matching Friday-to-Friday S&P 500 changes with bitcoin’s change over the same weeks gives 102 pairs and a correlation of 0.25 [1][2]. A value near zero would mean the two move independently; one near 1 would mean they move together. The figure here is my calculation and says only how the two behaved in this window, not how they will behave next. It supports the narrower point already made: a calm index week and a large bitcoin week can happen together.
What not to conclude
- No cause is established here. Price data shows what moved, not why.
- A week is a thin sample. Bitcoin has sold off as sharply as it has rallied.
- The calendar differs. Bitcoin has Saturday and Sunday closes; equities do not.
Prices are daily closes from Yahoo Finance’s historical data for BTC-USD and the S&P 500, as of the dates shown.
Questions readers ask
Does bitcoin trade on weekends?
Yes. Bitcoin trades continuously, so it has closing prices for Saturday and Sunday when stock exchanges are closed [1].
Did bitcoin move with the stock market this week?
Not closely. Bitcoin gained 7.3% from Tuesday to Sunday while the S&P 500 changed -0.08% over the week ended September 18 [1][2].
References
- Bitcoin USD (BTC-USD) Historical Data, Yahoo Finance — https://finance.yahoo.com/quote/BTC-USD/history/
- S&P 500 (^GSPC) Historical Data, Yahoo Finance — https://finance.yahoo.com/quote/%5EGSPC/history/