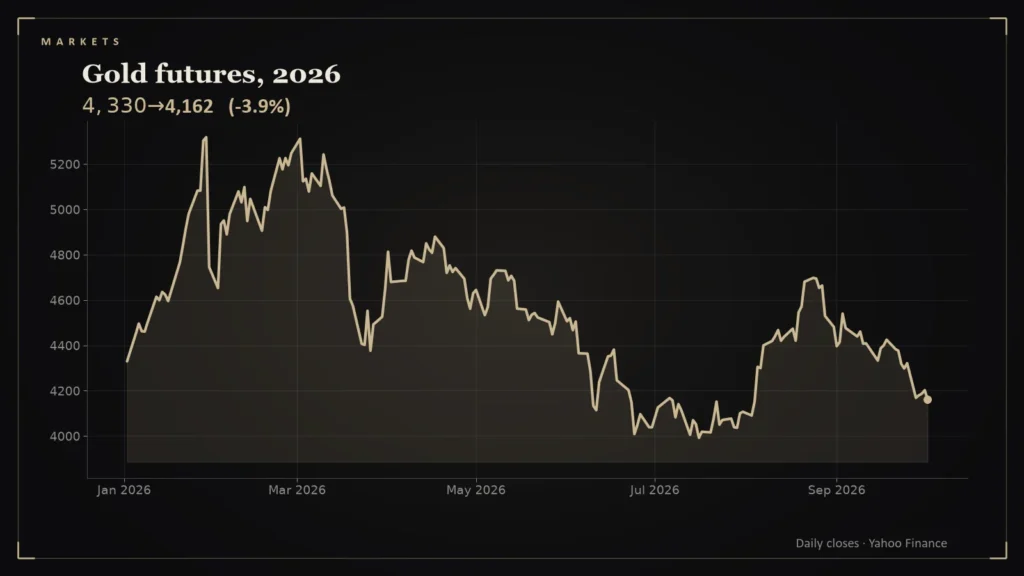
Gold is supposed to be the asset you buy when the world turns dangerous. In 2026 the world turned dangerous, and gold did the opposite of what the stereotype promises. The price data are blunt about it.
- Gold futures peaked at $5,318.40 on January 29, 2026, closed at $5,247.90 on February 27, and bottomed at $3,992.10 on July 16 [1].
- On October 4 gold was around $4,175.90, about 21.5 percent below its peak and about 3.8 percent lower for 2026 [1].
- Silver fell from $115.08 on January 26 to about $61.09, a drop of roughly 47 percent [2].
- Over the same period the 10-year yield rose from 3.96 to 5.28 percent and the dollar index rose about 3.7 percent [3][4].
The numbers
Yahoo Finance’s gold futures history shows a 2026 peak of $5,318.40 on January 29, a price of $5,247.90 on February 27, the day before the war with Iran began, and a trough of $3,992.10 on July 16 [1]. The latest quote, $4,175.90, is about 21.5 percent below the peak and 3.8 percent below the 2025 close of $4,341.10 [1]. Silver moved further: from a high of $115.08 on January 26 to roughly $61.09, a decline near 47 percent [2].
What gold was up against
Two headwinds line up with the decline. The 10-year Treasury yield rose from 3.96 percent on February 27 to 5.28 percent on October 2 [3], and the dollar index rose from 96.22 on January 27 to about 101.87 [4]. Gold pays no interest and is priced in dollars, so higher yields and a stronger dollar both raise the cost of owning it. The correlation is consistent with the textbook story; the data do not prove it.
The lesson about safe havens
A safe haven is only safe against the risk you are afraid of. In March, the risk was an energy shock, which pushed up inflation and interest rates, the two things that hurt gold most. Investors who bought gold in January because of geopolitical worry had picked the right fear and the wrong channel.
A reversal in two moves
Most of the damage came in two bursts. The day after the January 29 peak, gold fell 10.8 percent on 1/30 to $4,745, the largest one-day fall in the two years of data I reviewed [1]. From the peak of $5,318.40 to the July 16 low of $3,992.10 the metal fell 24.9 percent, and from that low to the October 2 close of $4,162.30 it recovered 4.3 percent (my calculation from daily closes) [1].
The comparison with silver is a reminder of how much leverage the smaller metal carries. Silver fell about 47 percent from its January 26 peak to about $61 [2], roughly twice as far as gold from its peak. The rise in the 10-year yield from 3.96 to 5.28 percent and the dollar index’s gain of about 3.7 percent happened over the same period [3][4], conditions that the forgone-interest argument predicts will weigh on a metal that pays nothing. That is an association in the data, not proof of cause.
What to watch
- Real yields and the dollar, the likeliest drivers of the next big gold move.
- The gap between gold and silver: silver’s 47 percent fall shows how much of the January surge was speculative.
- Central-bank buying and ETF flows, which the price series cannot show but analysts follow.
Gold has not collapsed; it remains far above where it traded for most of the previous decade. It has just reminded everyone that no asset is immune to the rate cycle. This is analysis, not investment advice.
Questions readers ask
How much has gold fallen from its 2026 high?
About 21.5 percent, from $5,318.40 on January 29 to roughly $4,176 on October 4, according to Yahoo Finance futures data [1].
Why did gold fall during a war?
It coincided with higher Treasury yields and a stronger dollar, which raise the cost of holding a non-yielding asset, though the data do not prove causation [1][3][4].
References
- Gold Futures (GC=F) Historical Prices — Yahoo Finance — https://finance.yahoo.com/quote/GC%3DF/history/
- Silver Futures (SI=F) Historical Prices — Yahoo Finance — https://finance.yahoo.com/quote/SI%3DF/history/
- CBOE 10-Year Treasury Yield (^TNX) Historical Data — Yahoo Finance — https://finance.yahoo.com/quote/%5ETNX/history/
- U.S. Dollar Index (DX-Y.NYB) Historical Prices — Yahoo Finance — https://finance.yahoo.com/quote/DX-Y.NYB/history/