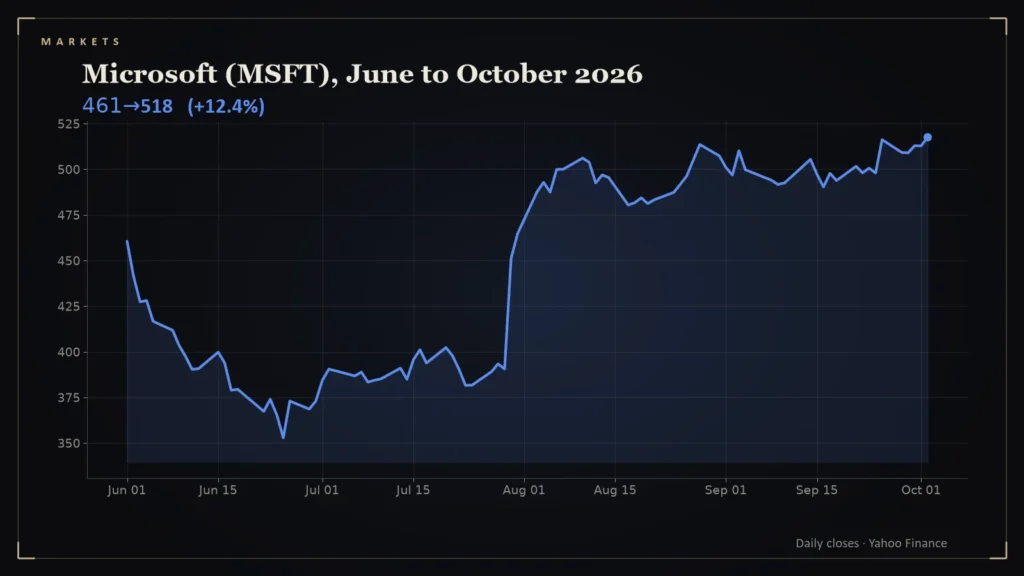
Most 2026 stock charts have one big drop. Microsoft’s has a long slide and then a surge, and the low did not come in March with the rest of the market. It came in late June.
- Microsoft closed 2025 at $483.62, fell to $352.83 on June 25, and closed at a 2026 high of $517.53 on October 2, up about 7.0 percent for the year [1].
- The rebound from the June low is about 47 percent [1].
- Azure grew 40 percent in Q1 2026 and was estimated near 39 percent in Q2 [2].
- Microsoft guided to $190 billion in capital expenditures and finance leases for 2026, including about $25 billion tied to higher component prices [2].
The path
According to Yahoo Finance, Microsoft ended 2025 at $483.62. It slid to $352.83 on June 25, a drop of about 27 percent from the year’s start, and then rallied to $517.53 on October 2, the highest close of 2026. That is a gain of roughly 47 percent from the June low, and about 7 percent for the year [1].
The business case
Azure, Microsoft’s cloud platform, grew 40 percent in the first quarter, with analysts estimating about 39 percent for the second [2]. The company also guided to $190 billion of capital expenditures and finance leases for 2026, including about $25 billion attributed to higher component prices caused by AI chip demand [2]. That makes Microsoft both one of the biggest beneficiaries of AI demand and one of the biggest spenders.
Why the timing differs
Microsoft’s low came three months after the broad market’s, which suggests that company-specific concerns, probably the scale of its spending and the return it would earn, mattered more than the macro shock. The price data cannot say which; they only show that the sell-off and the recovery both happened on a different calendar than the S&P 500’s.
The drawdown before the rebound
The June low came after a long slide. From a 2026 closing high of $483.62 on December 31 the stock fell to the June 25 low of $352.83, a drop of 27.0 percent, and then recovered 47 percent to the October 2 close [1] (my calculation from daily closes). Daily changes of 3 percent or more, up or down, occurred on 25 of 189 sessions in 2026 through October 2 [1].
The underlying business signals were more stable than the price. Azure grew 40 percent in the first quarter and was estimated to have grown about 39 percent in the second, while the company guided to $190 billion of capital expenditures and finance leases for 2026, including roughly $25 billion tied to higher component prices from AI chip demand [2]. A stock can swing widely around steady growth when the market keeps re-pricing what that growth is worth, which is what the V-shape reflects.
What a record high means
- It does not mean the stock is expensive or cheap, only that buyers have paid more than ever before.
- It follows a 47 percent rise in four months, which is a lot to sustain.
- The same factors that drove it up, AI demand and cloud growth, are the ones to watch if it turns.
The best use of a chart like this is as a reminder that big companies can be volatile too. This is analysis, not investment advice.
Questions readers ask
How has Microsoft stock done in 2026?
It fell to $352.83 on June 25 and recovered to a 2026 high of $517.53 on October 2, up about 7.0 percent for the year [1].
How fast is Azure growing?
Azure grew 40 percent in the first quarter and was estimated at about 39 percent in the second [2].
References
- Microsoft (MSFT) Historical Prices — Yahoo Finance — https://finance.yahoo.com/quote/MSFT/history/
- AI investment worries spread after Alphabet capex hike; Amazon, Microsoft, Meta also face scrutiny — Digital Today — https://www.digitaltoday.co.kr/en/view/86477/ai-investment-worries-spread-after-alphabet-capex-hike-amazon-microsoft-meta-also-face-scrutiny