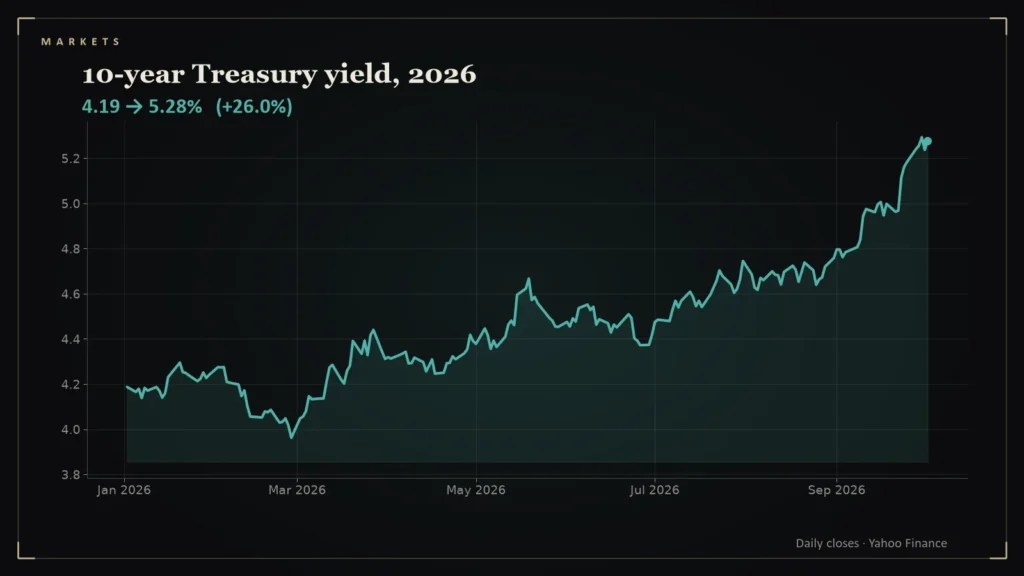
The Fed sets the overnight rate. The market sets the 10-year yield, which anchors mortgages, corporate borrowing and the discount rate behind every stock valuation. In 2026, the market has set it higher, and fast.
- The 10-year Treasury yield was 3.96 percent on February 27, 2026, 4.42 percent on June 30, 5.01 percent on September 16 and 5.28 percent on October 2 [1].
- It finished 2025 at 4.16 percent, so it is up about 1.1 percentage points for 2026 [1].
- The Fed’s target range is now 3.75 to 4.00 percent, so the 10-year yield sits roughly 1.3 points above the policy rate [1][2].
- The ECB also raised its deposit rate to 2.50 percent on September 16 [3].
The path
According to Yahoo Finance data, the 10-year yield was 3.96 percent on February 27, the last close before the war with Iran began, then climbed to 4.42 percent by the end of June, 5.01 percent on September 16 (the day of the Fed decision) and 5.28 percent on October 2, close to its September 30 high of 5.29 percent [1]. It began the year at 4.16 percent [1].
The gap to the policy rate
After the September 16 hike the Fed’s target range is 3.75 to 4.00 percent [2]. A 10-year yield of 5.28 percent is more than a full percentage point above the top of that range. A positive gap like this means investors are demanding extra compensation to lend for a decade, which usually reflects expectations for inflation or heavier government borrowing, or both. The data alone do not say which.
A global story
The move is not only American. The European Central Bank raised its three policy rates by 25 basis points effective September 16, taking its deposit facility rate to 2.50 percent [3]. Central banks on both sides of the Atlantic are leaning against an energy-driven rise in prices: U.S. CPI was up 3.4 percent from a year earlier in August, with energy up 16.3 percent [4].
Month by month
Measured at month-end closes, the 10-year yield rose in 7 of the 10 months from January to the start of October (the last month is only a few days long), by 54 basis points in the largest rise (September) and fell by 28 basis points in the largest decline (February) [1]. The yield closed at or above 5 percent on 9 days in 2026 through October 2 [1]. Those counts are my calculation from daily closes.
The policy-rate gap looks different from the term-structure story. With the Fed’s target range at 3.75 to 4.00 percent after September 16, the 10-year yield of 5.28 percent sits about 1.4 percentage points above the midpoint of the range [1][2]. A positive gap between long and short rates is the normal shape of the curve, and a wider one can reflect expectations for growth and inflation, extra compensation for holding long bonds, or both. The data show the gap, not the reason for it.
Why it matters beyond bonds
- Mortgages and loans follow long yields, so borrowing costs have risen even before further Fed moves.
- Stock valuations are sensitive to the rates used to discount future earnings, which is one reason growth stocks react strongly to yield moves.
- Government finances pay more to roll over debt.
The market is telling a consistent story: the era of cheap long-term money is under pressure. Whether 5.3 percent is a peak or a waypoint will depend on inflation, and inflation depends in part on a shipping lane. This is analysis, not investment advice.
Questions readers ask
What is the 10-year Treasury yield?
As of October 2, 2026 it was 5.28 percent, up from 3.96 percent on February 27 and 4.16 percent at the end of 2025 [1].
Why are long-term yields rising in 2026?
Central banks are raising rates against energy-driven inflation, and the 10-year yield sits more than a point above the Fed’s target range; the data show the move but not a single cause [1][2][3][4].
References
- CBOE 10-Year Treasury Yield (^TNX) Historical Data — Yahoo Finance — https://finance.yahoo.com/quote/%5ETNX/history/
- Federal Reserve Press Release, September 16, 2026 — Federal Reserve Board — https://federalreserve.gov/newsevents/pressreleases/monetary20260916a.htm
- ECB Key Interest Rates — European Central Bank — https://www.ecb.europa.eu/stats/monetary/rates/html/index.en.html
- Consumer Price Index — August 2026 — U.S. Bureau of Labor Statistics — https://www.bls.gov/news.release/cpi.nr0.htm