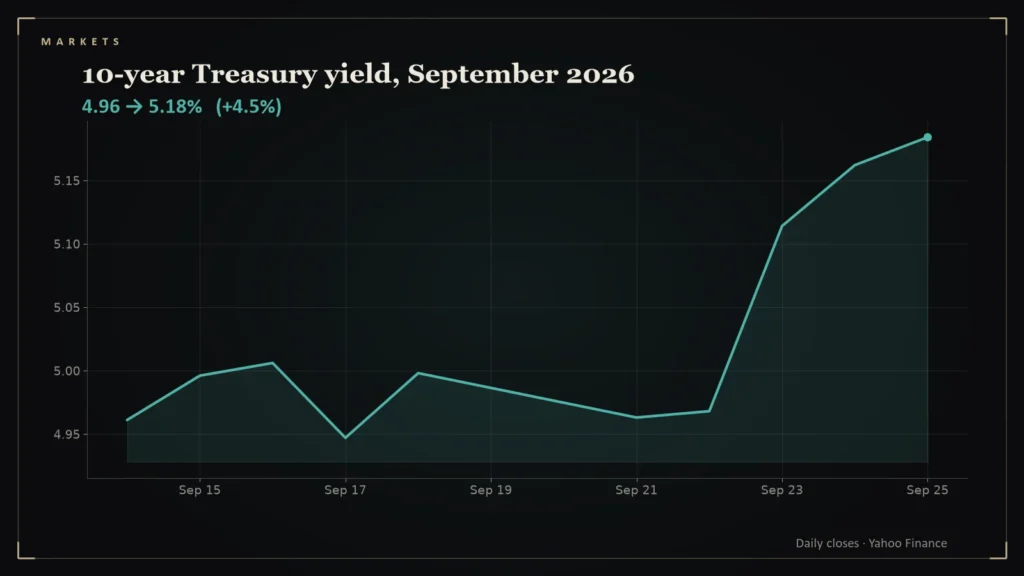
Bond yields can look like a dull decimal until they jump, and then they behave like a seesaw with a heavy child on one end: yields go up, prices go down, and the longer the bond, the harder the drop.
- The 10-year yield closed at 4.97% on September 22 and 5.16% on September 24, a rise of 19 basis points [1].
- A newly issued 10-year bond at the old yield would lose about 1.5% of its market value after that move (simplified annual-pay arithmetic).
- Bond prices and yields move in opposite directions; the longer the bond, the bigger the price swing for a given yield move.
- Long-term yields, not the Fed’s policy rate, anchor most mortgage and corporate borrowing costs.
The move
The 10-year Treasury yield stood at 4.97% on September 22. It closed at 5.11% on September 23 and 5.16% on September 24 [1]. That is 19 basis points in two sessions. A basis point is one hundredth of a percentage point.
The arithmetic of a price drop
A bond’s price is the present value of its payments. Take a simplified 10-year bond with a face value of 100, paying a coupon of 4.97 once a year, bought at par when the market yield is 4.97%. If the market yield rises to 5.16%, the same cash flows are worth 98.51 instead of 100.00, a loss of 1.5% [2]. The real bond market pays coupons twice a year, so this is an approximation, but it shows the order of magnitude.
Why this reaches households
The Federal Reserve sets a short-term policy rate. Long-term borrowing costs are set by markets, and the 10-year Treasury yield is a common benchmark for them. When the 10-year rises, the cost of fixed-rate mortgages and corporate bonds tends to rise too. Savers gain because new bonds pay more, while holders of bond funds see the market value of older bonds fall.
Longer bonds fall further
The same 19-basis-point rise hurts longer bonds more. Using the same simplified method as above (annual coupons, bought at par at a 4.97% yield, repriced at 5.16%), the table shows the price change for four maturities [2]:
| Maturity | Price at 4.97% | Price at 5.16% | Change |
|---|---|---|---|
| 2-year | 100.00 | 99.65 | -0.35% |
| 5-year | 100.00 | 99.18 | -0.82% |
| 10-year | 100.00 | 98.54 | -1.46% |
| 30-year | 100.00 | 97.13 | -2.87% |
A two-year note barely notices the move, while a 30-year bond loses several times as much as a 10-year. That is why long-term yields matter so much to pension funds and mortgage markets. Looking at the 10-year series itself, 8 of 494 two-day windows since October 2024 showed a rise of 15 basis points or more, so a jump of this size has happened before [1]. The count is my calculation from daily closes. Real bonds pay semiannual coupons and trade at prices that differ from par, so treat the table as an illustration of the pattern, not a quote.
Keeping it in proportion
- Two days is a short window. Yields have also reversed quickly in the past.
- The arithmetic is a simplification. It ignores semiannual coupons, taxes and fees.
- No cause is claimed. The yield series shows the move, not the reason.
Yields are daily closes of the CBOE 10-Year Treasury Yield index as shown on Yahoo Finance.
Questions readers ask
What does a basis point mean?
A basis point is one hundredth of a percentage point, so 19 basis points is 0.19 percentage points [1].
Why do bond prices fall when yields rise?
Because an existing bond’s fixed payments become less attractive next to new bonds paying more, so its market price drops until its effective yield matches [2].
References
- CBOE 10-Year Treasury Yield (^TNX) Historical Data, Yahoo Finance — https://finance.yahoo.com/quote/%5ETNX/history/
- Treasury Notes and Bonds, TreasuryDirect — https://www.treasurydirect.gov/marketable-securities/treasury-notes/