Earnings per share can be shaped by accounting, buybacks, tax rates and investment gains. Revenue is simpler: it is what customers paid. That is why analysts treat a sales beat as the cleaner signal of whether business is actually good.
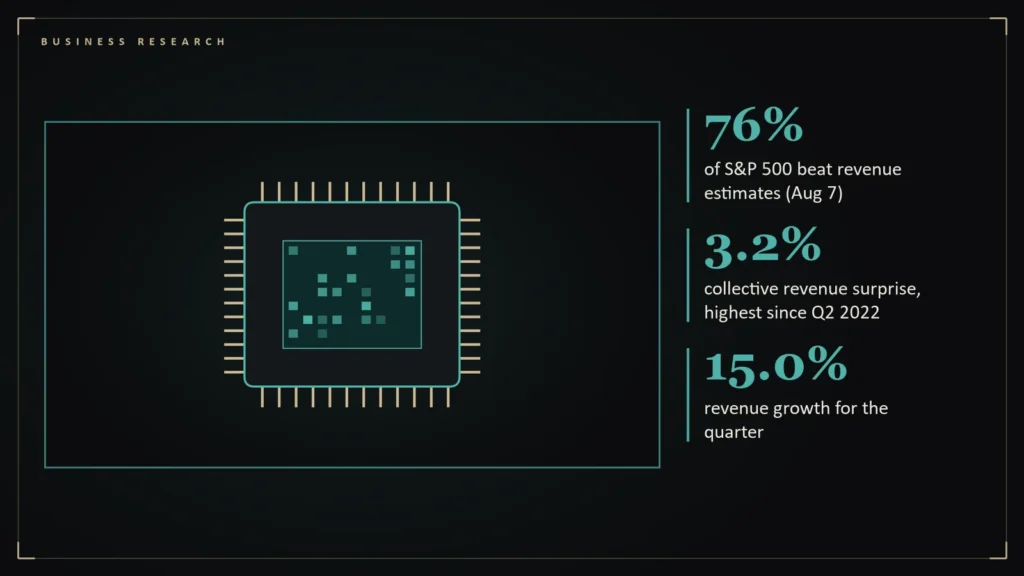
- As of August 7, 2026, 76 percent of S&P 500 companies beat revenue estimates, with a collective surprise of 3.2 percent, the highest since Q2 2022 [1].
- Revenue growth for the quarter was 15.0 percent [1].
- On July 24, 80 percent had beaten revenue estimates and revenue growth was 13.2 percent [2].
- Revenue is harder to flatter than EPS because it sits above buybacks, tax rates and investment gains.
The Q2 revenue numbers
FactSet’s August 7 update shows that 76 percent of S&P 500 companies beat revenue estimates in the second quarter of 2026, by 3.2 percent in aggregate, the highest revenue surprise since the second quarter of 2022. Revenue grew 15.0 percent from a year earlier [1]. The July 24 update, with fewer companies reported, had 80 percent beating and 13.2 percent growth, the strongest since Q2 2022 [2].
Why revenue is cleaner
- Buybacks: a company can raise EPS by retiring shares without selling anything more.
- Taxes and one-offs: a lower tax rate or an investment gain boosts EPS but not revenue.
- Accounting choices: depreciation and reserves move earnings; they do not change what customers spent.
In Q2, the difference mattered: EPS growth of 50.4 percent included gains at Alphabet and Amazon, while revenue growth of 15.0 percent did not [1].
A limit to the signal
Revenue in an inflationary year includes price increases. With CPI at 3.4 percent in August and energy up 16.3 percent from a year earlier [3], a part of the revenue growth in sectors such as Energy reflects higher prices, not higher volumes. A sales beat does not tell you which.
Revenue in more detail
FactSet’s revenue figures give a clearer picture. Seventy-six percent of companies reported revenue above estimates, compared with a five-year average of 70 percent and a ten-year average of 68 percent, and the collective surprise of 3.2 percent was the highest since the second quarter of 2022 [1]. Blended revenue growth rose to 15.0 percent from 14.2 percent a week earlier and 12.2 percent at quarter-end, the strongest since the fourth quarter of 2021 (16.1 percent) and the second straight quarter of double-digit growth [1].
The breadth is notable: all eleven sectors reported year-over-year revenue growth, and five posted double-digit growth, led by Energy, Information Technology and Communication Services [1]. Energy and Health Care produced the largest revenue surprises, while Energy, Health Care and Financials contributed most to the change in revenue since June 30 [1]. That pattern supports the article’s point that a revenue beat is harder to engineer with accounting choices than an EPS beat, though it does not remove the possibility that strong prices, particularly in energy, flatter the numbers.
How to use it
When a company reports, look at revenue first, then margin, then EPS. A beat on all three is a strong quarter. A beat on EPS alone, with flat revenue, is a financial-engineering story and deserves an extra question. This is analysis, not investment advice.
Questions readers ask
Why is revenue considered a cleaner signal than EPS?
Because EPS can be affected by buybacks, taxes and investment gains, while revenue reflects customer spending [1].
How strong was revenue growth in Q2 2026?
15.0 percent as of August 7, with 76 percent of S&P 500 companies beating estimates [1].
References
- S&P 500 Earnings Season Update, August 7, 2026 — FactSet — https://insight.factset.com/sp-500-earnings-season-update-august-7-2026
- S&P 500 Earnings Season Update, July 24, 2026 — FactSet — https://insight.factset.com/sp-500-earnings-season-update-july-24-2026
- Consumer Price Index — August 2026 — U.S. Bureau of Labor Statistics — https://www.bls.gov/news.release/cpi.nr0.htm