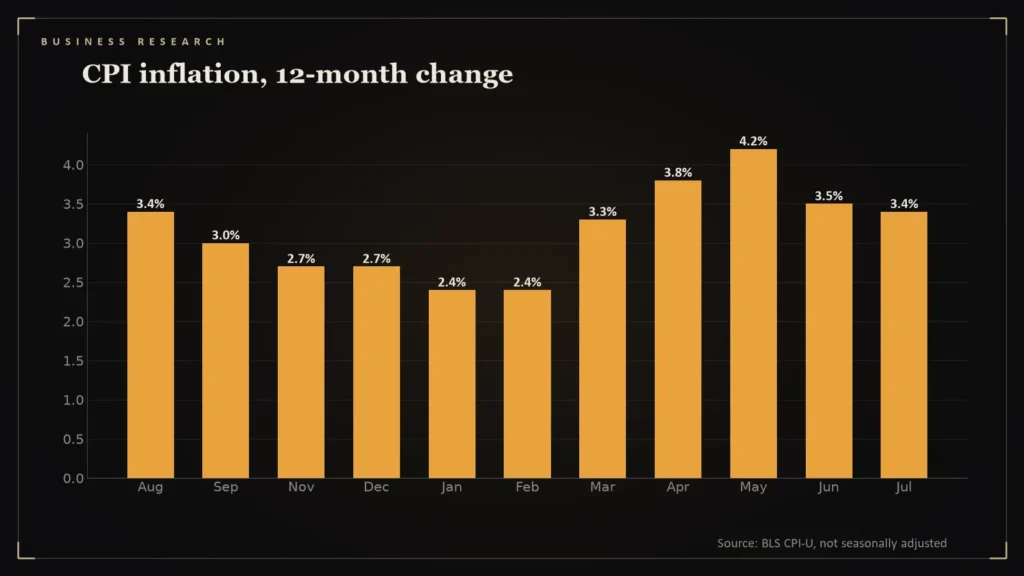
Inflation did not creep up in 2026. It stepped up in a month and then drifted lower. Here is the whole path from the BLS index.
- Twelve-month CPI inflation (not seasonally adjusted) was about 2.4 percent in January and February 2026, 3.3 percent in March, 3.8 percent in April and 4.3 percent in May (my calculation from BLS data) [1].
- It eased to about 3.5 percent in June and 3.4 percent in both July and August; the BLS reported 3.4 percent for August [1][2].
- Core CPI was 2.4 percent in August, well below the headline, because energy was up 16.3 percent [2].
- The shape tracks the oil price: Brent rose from $72.48 on February 27 to $118.35 on March 31 [3].
The monthly path
| Month (2026) | 12-month CPI change |
|---|---|
| January | 2.4% |
| February | 2.4% |
| March | 3.3% |
| April | 3.8% |
| May | 4.3% |
| June | 3.5% |
| July | 3.4% |
| August | 3.4% |
Source: BLS CPI-U index, not seasonally adjusted, my calculations; the BLS reported 3.4 percent for August [1][2].
The jump
The change between February and March is the headline: from about 2.4 to 3.3 percent in a single month, then to 3.8 percent in April and a peak of roughly 4.3 percent in May [1]. That is the signature of an energy shock. The war began on February 28 and Brent rose from $72.48 to $118.35 in a month [3].
The retreat
Inflation fell to about 3.5 percent in June as oil retreated to the low $70s, and held near 3.4 percent through August [1][3]. Seasonally adjusted, the index fell 0.4 percent in June, a rare monthly decline [1].
The core is calmer
Core CPI, which excludes food and energy, was up 2.4 percent over 12 months in August. Energy was up 16.3 percent and gasoline 27.4 percent [2]. The difference shows that the surge is concentrated, not broad.
The index values behind the percentages
The percentages come from index levels. Here are the not-seasonally-adjusted CPI-U values for each month of 2026 and the same month of 2025, with the twelve-month change calculated from them (my calculation from the BLS series) [1]:
| Month | 2026 index | 2025 index | 12-month change |
|---|---|---|---|
| Jan | 325.3 | 317.7 | 2.4% |
| Feb | 326.8 | 319.1 | 2.4% |
| Mar | 330.2 | 319.8 | 3.3% |
| Apr | 333.0 | 320.8 | 3.8% |
| May | 335.1 | 321.5 | 4.2% |
| Jun | 334.0 | 322.6 | 3.5% |
| Jul | 333.9 | 323.0 | 3.4% |
| Aug | 335.0 | 324.0 | 3.4% |
The table makes the shape visible and shows why the path is partly arithmetic. Twelve-month inflation depends on what happened a year earlier as well as on this month’s price change, so base effects matter: the same monthly price change produces a different twelve-month figure depending on the month it is compared with. The August reading of 3.4 percent matches the BLS release, and the monthly rise that month was 0.4 percent, with gasoline responsible for more than a third of it [2]. The retreat from May’s peak is real, but it leaves inflation above the level of January and February, when it was about 2.4 percent [1].
What it means for the Fed
A central bank will look through a one-time energy shock if it expects the price level to settle, but it will act if it fears expectations are rising. On September 16 the Fed raised rates, saying inflation remains elevated [4]. University of Michigan year-ahead inflation expectations rose to 4.6 percent in September [5]. This is analysis, not investment advice.
Questions readers ask
What was U.S. inflation in 2026?
About 2.4 percent in January, peaking near 4.3 percent in May, and 3.4 percent in August, by BLS data [1][2].
Why did inflation jump in March 2026?
Energy prices surged after the war with Iran began on February 28; Brent rose about 63 percent in a month [3].
References
- BLS Public Data API: Consumer Price Index, series CUUR0000SA0 — https://api.bls.gov/publicAPI/v1/timeseries/data/CUUR0000SA0
- Consumer Price Index — August 2026 — U.S. Bureau of Labor Statistics — https://www.bls.gov/news.release/cpi.nr0.htm
- Brent Crude Oil (BZ=F) Historical Prices — Yahoo Finance — https://finance.yahoo.com/quote/BZ%3DF/history/
- Federal Reserve Press Release, September 16, 2026 — Federal Reserve Board — https://federalreserve.gov/newsevents/pressreleases/monetary20260916a.htm
- U.S. consumer sentiment slips in September, inflation expectations rise — The Star (Reuters) — https://www.thestar.com.my/news/world/2026/09/12/us-consumer-sentiment-slips-in-september-inflation-expectations-rise