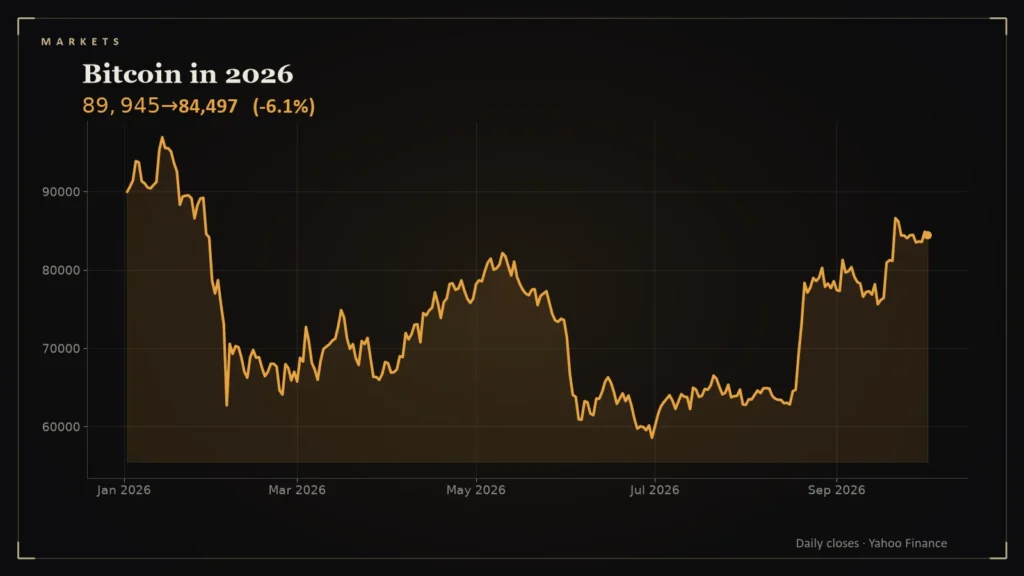
Bitcoin had a year with three acts: a January high, a long slide into June, and a late-summer recovery. Each had its own cause.
- Bitcoin ended 2025 near $87,509, peaked at $96,929 on January 14, 2026, fell to $58,559 on June 30, and was near $84,497 on October 2, down about 3.4 percent for the year [1].
- In late June it hit a 21-month low near $58,980, more than 50 percent below its October 2025 peak of $126,080 [2].
- Drivers cited: inflation near 4.2 percent, more than $6 billion of ETF outflows over six weeks, and over $3 billion of liquidations [2].
- Strategy, the largest corporate holder, sold 32 bitcoin, its first sale since late 2022 [2].
The path in prices
Yahoo Finance data show Bitcoin closing 2025 at $87,509, reaching a 2026 high of $96,929 on January 14, trading at $66,691 on March 30, hitting a 2026 low of $58,559 on June 30, and closing near $84,497 on October 2. That is about 3.4 percent below where it began the year and about 44 percent above the low [1].
The June low
Analytics Insight reported Bitcoin falling to about $58,980 on June 26, a 21-month low and more than 50 percent below its October 2025 record of $126,080. It cited persistent inflation near 4.2 percent that kept borrowing costs elevated; $4.4 billion of ETF withdrawals during a 13-day outflow streak and more than $6 billion over six weeks; and a fall from $67,000 to $59,100 between June 4 and 6 that triggered over $3 billion in forced liquidations [2]. Strategy, the world’s largest corporate bitcoin holder, disclosed selling 32 bitcoin, a small amount but its first sale since late 2022 [2].
The macro link
Bitcoin behaved less like digital gold and more like a risk asset. U.S. CPI inflation peaked near 4.3 percent in May (my calculation from BLS data) and the Fed raised rates in September [3][4]. As the 10-year yield rose, assets with no cash flow, like gold and Bitcoin, struggled [5].
The recovery
From the June 30 low, Bitcoin rose to about $78,500 by the end of August and about $84,500 by early October [1]. The rebound coincided with a broader recovery in equities from the March lows.
The anatomy of the June break
The slide was not smooth. Bitcoin dropped from about $67,000 to about $59,100 between June 4 and June 6, triggering liquidations, and first broke below $60,000 on June 26, touching nearly $58,980 [2]. In the first half of June $4.4 billion left spot ETFs during a 13-day outflow streak [2]. Over a 48-hour stretch more than $3 billion in leveraged positions were forced to close, about 85 percent of them long positions [2]. Ethereum fell close to $1,530, and the total crypto market had lost nearly $2 trillion compared with the 2025 peak [2].
From the January 14 peak of $96,929 to the June 30 close of $58,559 is a fall of 39.6 percent, and from that low to the October 2 close of $84,497 is a rise of 44 percent (my calculation from daily closes) [1]. At the time of the low, some analysts warned the price could fall toward $48,000 if support failed, and the Crypto Fear and Greed Index sat in extreme fear [2]. It did not happen, which is a reminder that technical-analysis targets are conditional statements, not forecasts.
What the path teaches
- Crypto trades with liquidity: ETF flows and leverage both matter.
- Single-asset narratives (“digital gold”) are tested by rate cycles.
- Volatility cuts both ways: a 40 percent fall and a 44 percent recovery in nine months.
This is analysis, not investment advice.
Questions readers ask
What was Bitcoin's 2026 low?
$58,559 on June 30 in Yahoo Finance daily data; a report put the intraday low near $58,980 on June 26 [1][2].
Why did Bitcoin fall in June 2026?
Reported drivers included inflation near 4.2 percent, heavy ETF outflows, large liquidations and a small sale by Strategy [2].
References
- Bitcoin USD (BTC-USD) Historical Prices — Yahoo Finance — https://finance.yahoo.com/quote/BTC-USD/history/
- Bitcoin Hits 21-Month Low: What's Behind the Price Drop? — Analytics Insight — https://www.analyticsinsight.net/bitcoin/bitcoin-hits-21-month-low-whats-behind-the-price-drop
- BLS Public Data API: Consumer Price Index, series CUUR0000SA0 — https://api.bls.gov/publicAPI/v1/timeseries/data/CUUR0000SA0
- Federal Reserve Press Release, September 16, 2026 — Federal Reserve Board — https://federalreserve.gov/newsevents/pressreleases/monetary20260916a.htm
- CBOE 10-Year Treasury Yield (^TNX) Historical Data — Yahoo Finance — https://finance.yahoo.com/quote/%5ETNX/history/