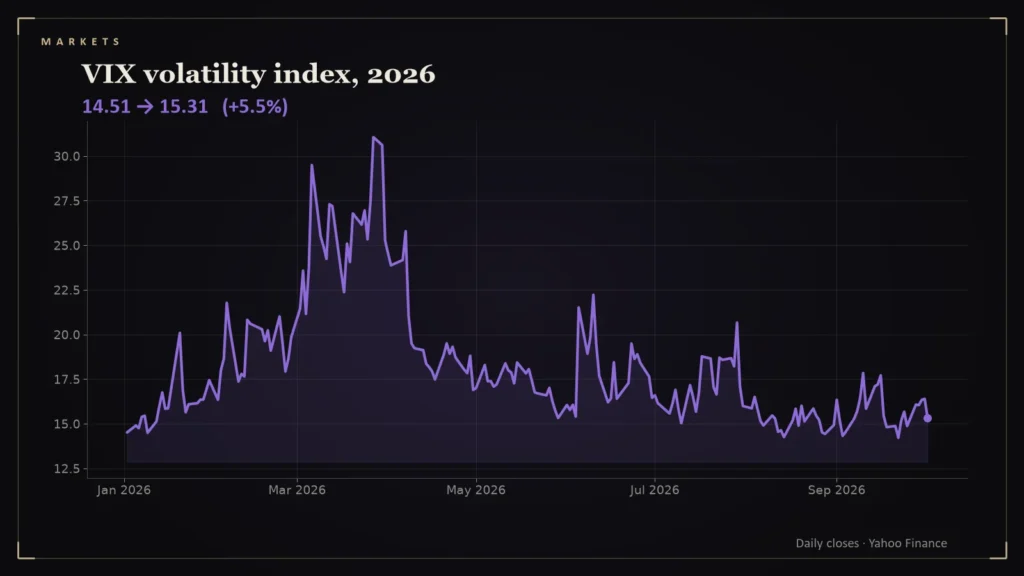
The VIX is called the fear gauge, but it is really a price: the price of insurance on the stock market. When the price spikes, fear is high. When it is low, insurance is cheap.
- The VIX reached 31.05 on March 27, 2026, its 2026 high; its low was 14.21 on September 22; it closed at 15.31 on October 2 [1].
- The VIX is derived from S&P 500 option prices and expresses expected 30-day volatility as an annualized percentage.
- A VIX of 31 implies the market expects moves of roughly 9 percent over a month (31 divided by the square root of 12, a rule of thumb).
- Low readings are not a guarantee of calm; they mean options are cheap.
The 2026 readings
According to Yahoo Finance, the VIX closed at 31.05 on March 27, 2026, the highest of the year, as the war with Iran and the oil spike unsettled markets. It sank to 14.21 on September 22 and closed at 15.31 on October 2 [1]. That is a range of more than 16 points in six months.
How it is built
The VIX is calculated from prices of S&P 500 index options. It reflects the market’s expectation of how much the index will move over the next 30 days, quoted as an annualized percentage. It is forward-looking: it measures what traders are paying to hedge, not what has happened.
A back-of-envelope translation
Because the figure is annualized, divide by the square root of 12 to get an expected one-month range. A VIX of 31 implies roughly a 9 percent one-standard-deviation move over a month; a VIX of 15 implies about 4.3 percent. That is a rule of thumb, not a forecast, and it is symmetric even though investors fear falls more than rises.
Reading the number
- Below 15: options are cheap and the market is calm; complacency is possible.
- 15 to 25: typical conditions.
- Above 30: stress, as in March 2026.
Compare those readings with the S&P 500’s actual path: it fell about 9.1 percent from January 27 to March 30 and then gained about 22 percent from the low [2]. The VIX warned of the first and quieted during the second.
What the readings imply, and how often
The rule of thumb that divides the VIX by the square root of 12 turns each reading into an implied one-month range (the standard-deviation interpretation, which is a rough guide):
| VIX | Implied one-month move (one standard deviation) |
|---|---|
| 14.21 | ±4.1% |
| 15.31 | ±4.4% |
| 20.00 | ±5.8% |
| 31.05 | ±9.0% |
In the closes I used, the VIX was at or above 20 on 38 of 191 sessions in 2026 through October 2 and at or above 25 on 14 [1] (my calculation). The S&P 500’s actual moves over the same stretch can be set against these figures: the March drawdown of about 9 percent from the January high is roughly one implied standard deviation at the peak reading [2]. That is the useful way to read the gauge, as a price of insurance, not as a forecast.
The limit of the gauge
The VIX can stay low for a long time and then jump in a day. It tells you the price of protection now, not what comes next. For most long-term investors, its main value is as a thermometer for the market’s mood. This is analysis, not investment advice.
Questions readers ask
What is the VIX?
An index derived from S&P 500 option prices that reflects expected 30-day volatility, often called the fear gauge.
What was the VIX's high in 2026?
31.05 on March 27, 2026, according to Yahoo Finance data [1].
References
- CBOE Volatility Index (^VIX) Historical Prices — Yahoo Finance — https://finance.yahoo.com/quote/%5EVIX/history/
- S&P 500 (^GSPC) Historical Prices — Yahoo Finance — https://finance.yahoo.com/quote/%5EGSPC/history/