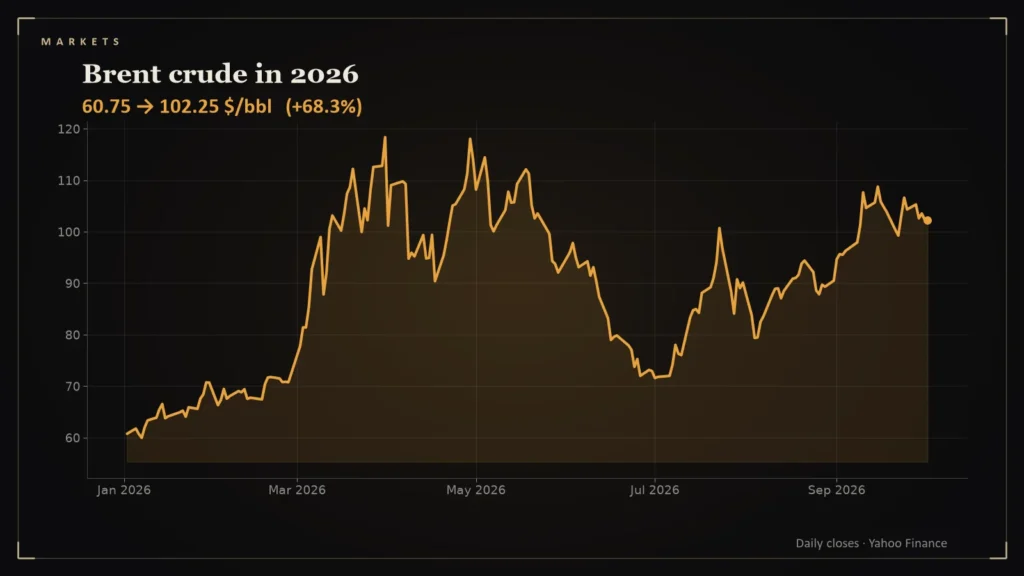
An average hides the motion. Brent’s 2026 is a series of sharp moves, and seven dates are enough to tell the story.
- Brent futures traded at $59.96 on January 7, $72.48 on February 27, $118.35 on March 31 and $114.01 on April 30 [1].
- By June 30 Brent was back at $72.92 and on July 1 at $71.57; it touched $100.69 on July 23 [1].
- It fell to $79.36 on August 4, then rose to $108.75 on September 15 and $102.25 on October 2 [1].
- Reported settlement prices differ slightly from these front-month futures; for example, a news report put Brent at $101.21 on September 10 [2].
| Date | Brent (front-month, Yahoo Finance) | What was happening |
|---|---|---|
| Jan 7 | $59.96 | 2026 low, before any shock |
| Feb 27 | $72.48 | Last close before war began [3] |
| Mar 31 | $118.35 | 2026 high, Hormuz traffic nearly halted |
| Apr 30 | $114.01 | Still elevated |
| Jun 30 | $72.92 | Prices back near pre-war levels |
| Sep 15 | $108.75 | Renewed US-Iran clashes |
| Oct 2 | $102.25 | Back above $100 |
Source: Yahoo Finance historical prices [1].
The first spike
The U.S. and Israel struck Iran on February 28. By March 13, Brent was above $100 as shipping through the Strait of Hormuz nearly halted, down from an average of 138 transits a day [3]. The IEA released 400 million barrels from emergency reserves, but prices held above $100 for weeks [3].
The retreat
By the end of June, Brent was back near $73 [1]. Part of that was demand destruction: China’s crude imports fell 32 percent from the first quarter to the second [4]. The price then rebounded to $100.69 on July 23, fell to $79.36 on August 4, and began rising again in September.
The second push
On September 10, a fresh wave of U.S.-Iran military escalation sent Brent above $100 for the first time since July, with a news report quoting a $101.21 settlement, and the EIA warning tanker restrictions could leave millions of barrels per day shut in through year-end [2].
Counting the days above $100
Brent futures closed at or above $100 on 58 of the 189 trading days in the series from January 2 to October 2, 2026, about 31 percent of sessions [1]. The longest unbroken stretch lasted 23 sessions, beginning April 22 [1]. The largest one-day gain was 9.6 percent on July 13 and the largest one-day fall was 14.5 percent on April 1 [1] (my calculation from the daily closes).
Remember the caveat already noted: these are front-month futures closes, and news reports of settlement prices can differ slightly [2]. The context for the extremes is the Hormuz disruption described in the March reporting and, later, the renewed clashes in September that returned prices above $100 [3][2]. The EIA’s analysis of China’s import cut supplies the demand-side piece, since weaker Chinese buying softened the price effect of lost supply [4].
What the path teaches
- Energy shocks come in waves; the first is rarely the last.
- Demand reacts with a lag, which is why prices can retreat while the supply problem persists.
- An annual average would hide a year in which the price range was nearly 2-to-1: $118.35 against $59.96.
This is analysis, not investment advice.
Questions readers ask
What was Brent's highest price in 2026?
$118.35 on March 31, per Yahoo Finance front-month futures [1].
Why do reported oil prices differ by source?
Sources use different contracts and settlement times; a news report cited $101.21 for September 10 while front-month futures data differ [1][2].
References
- Brent Crude Oil (BZ=F) Historical Prices — Yahoo Finance — https://finance.yahoo.com/quote/BZ%3DF/history/
- Brent climbs past $100 as US-Iran clashes in Strait of Hormuz reignite global energy fears — Business Today — https://www.businesstoday.in/world/story/brent-climbs-past-100-as-us-iran-clashes-in-strait-of-hormuz-reignite-global-energy-fears-554426-2026-09-10
- Oil stays above $100 a barrel amid Iran's stranglehold on Strait of Hormuz — Al Jazeera — https://www.aljazeera.com/amp/economy/2026/3/13/oil-stays-above-100-a-barrel-amid-irans-stranglehold-on-strait-of-hormuz
- China's crude oil imports fell in the second quarter — U.S. Energy Information Administration — https://www.eia.gov/TODAYinENERGY/detail.php?id=67905