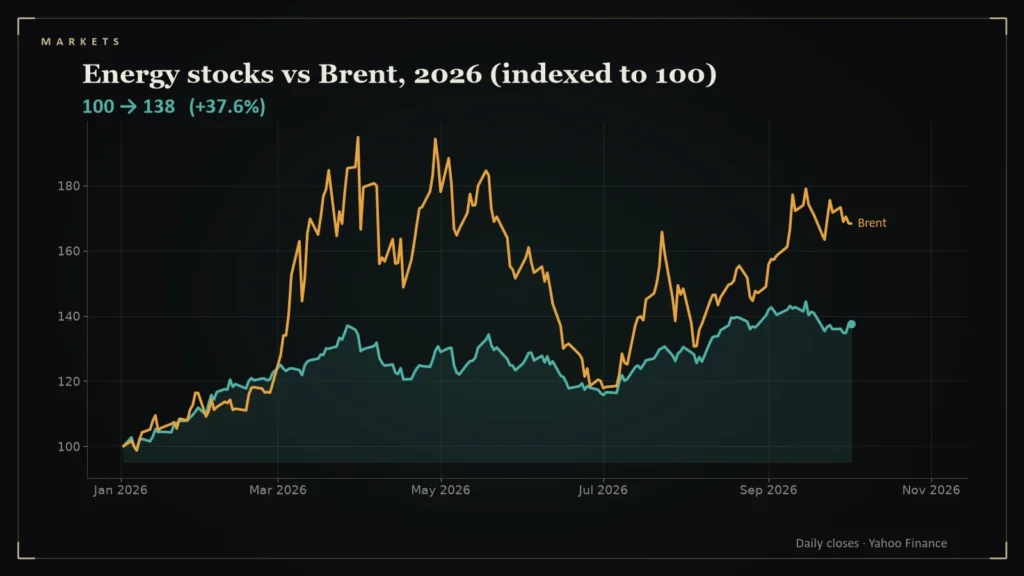
When oil jumps 60 percent, do oil stocks jump 60 percent? In 2026 they did not, and the reasons are a good lesson in how markets price different things.
- The Energy Select Sector SPDR (XLE) was up about 40.5 percent in 2026 through October 2; Brent futures were up about 68.5 percent [1][2].
- XLE peaked at $65.93 on September 15; Brent peaked at $118.35 on March 31 [1][2].
- XLE was already $62.56 on March 27, near the Brent peak, then gained only about 1.4 percent from the March 30 stock-market low [1].
- Stocks price expected long-run earnings; oil futures price today’s barrel.
The numbers
Through October 2, Yahoo Finance data show XLE up about 40.5 percent for the year, from $45.13 on January 7 to a high of $65.93 on September 15. Over the same period, Brent crude futures rose about 68.5 percent, from a low near $60 on January 7 to a high of $118.35 on March 31 [1][2].
Two different prices
Oil futures price a barrel delivered in the near term, and a shock to supply moves that price directly. A share of an oil company is a claim on all future profits for years. If investors believe prices will fall back, the stock rises less than the spot price. That is exactly what Brent’s retreat to about $73 at the end of June shows: temporary spikes do not carry through to stock prices in full [2].
Timing
Energy stocks moved early. XLE was $55.92 on February 27, before the war, and $62.56 on March 27, within days of the oil peak [1]. After the broad market low on March 30 it gained only 1.4 percent, while the Nasdaq Composite gained about 31 percent [1][3]. Energy was the first trade and the one that had already worked.
Other reasons for the gap
- Hedging: producers sell part of their output forward at fixed prices, which caps their gains from a spike.
- Costs: higher oil often raises costs for drilling and services.
- Discount rates: a 10-year yield above 5 percent lowers the present value of future earnings [4].
Month by month, side by side
Putting the two series next to each other by month shows how differently they behaved (month-end closes, my calculation) [1][2]:
| Month | XLE | Brent |
|---|---|---|
| Jan | +14.2% | +16.2% |
| Feb | +9.5% | +2.5% |
| Mar | +9.5% | +63.3% |
| Apr | -2.6% | -3.7% |
| May | -5.6% | -19.3% |
| Jun | -5.6% | -20.8% |
| Jul | +12.1% | +23.6% |
| Aug | +7.4% | +0.4% |
| Sep | -3.8% | +14.4% |
| Oct | +2.1% | -1.2% |
The correlation of their daily changes in 2026 through October 2 was 0.64 [1][2], positive but far from one. On a typical day, energy shares moved with oil only partially, because they are priced on expected earnings over many years, and the balance sheets and dividends of large producers do not swing with every barrel. That is the practical meaning of the contrast between a futures contract and a share of a company.
The takeaway
An asset that is a direct bet on a commodity price and an asset that is a business that sells it are different instruments. When a shock is expected to fade, equities will fade less visibly than the price of the underlying barrel. This is analysis, not investment advice.
Questions readers ask
Why did energy stocks rise less than oil in 2026?
Stocks price long-run earnings and expected prices, while oil futures price near-term barrels; producers also hedge and face rising costs [1][2].
How much is XLE up in 2026?
About 40.5 percent through October 2, versus about 68.5 percent for Brent [1][2].
References
- Energy Select Sector SPDR Fund (XLE) Historical Prices — Yahoo Finance — https://finance.yahoo.com/quote/XLE/history/
- Brent Crude Oil (BZ=F) Historical Prices — Yahoo Finance — https://finance.yahoo.com/quote/BZ%3DF/history/
- Nasdaq Composite (^IXIC) Historical Prices — Yahoo Finance — https://finance.yahoo.com/quote/%5EIXIC/history/
- CBOE 10-Year Treasury Yield (^TNX) Historical Data — Yahoo Finance — https://finance.yahoo.com/quote/%5ETNX/history/