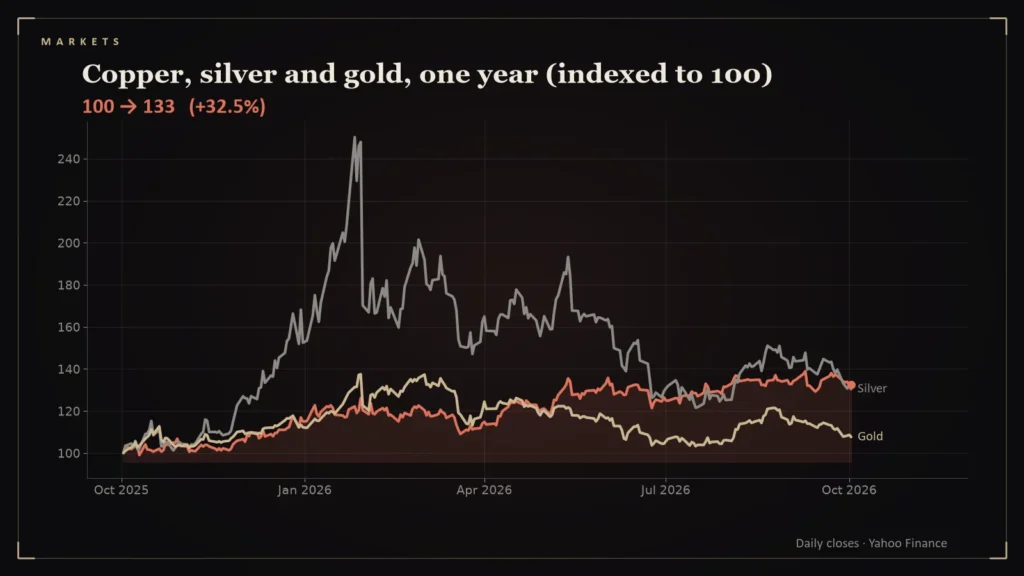
Metals are the economy’s pulse taken through the wrist: copper hums with factory and construction demand, silver is part industrial and part investment, and gold is mostly a store of value. A year of prices says a lot about which hand is on the throttle.
- Copper futures rose from $4.90 to $6.49 a pound in a year, a gain of 33% [1].
- Silver rose from $46.00 to $59.98 an ounce (+30%) and gold from $3,868 to $4,162 (+8%) [2][3].
- The U.S. Dollar Index rose from 97.85 to 101.93 (+4.2%), so metals rose despite a stronger dollar [4].
- Copper is used in wiring, motors and buildings; silver in both industry and investment.
One year, three metals
On October 2, 2025, copper futures closed at $4.90 a pound, silver at $46.00 an ounce and gold at $3,868.10. On October 2, 2026, they closed at $6.49, $59.98 and $4,162.30 [1][2][3]. That is gains of 33% for copper, 30% for silver and 8% for gold.
Copper: the doctor of the economy
Copper is called “Dr. Copper” by market commentators because it is used in so many products that its price is often read as a gauge of industrial demand. A 33% rise over a year is large. On the pound-for-pound arithmetic, ten thousand pounds of copper, about the weight of five mid-size cars, cost $48,980 a year ago and $64,920 now.
The dollar did not stop them
Metals priced in dollars often fall when the dollar strengthens, because they become more expensive for foreign buyers. The U.S. Dollar Index rose 4.2% over the year, from 97.85 to 101.93 [4]. Metals rose anyway, which suggests demand or supply forces outweighed the currency effect. The price data cannot say which forces.
Ratios and drawdowns
Two ratios sharpen the picture. The gold-to-silver ratio, the number of silver ounces needed to buy one ounce of gold, was 84.1 on October 2, 2025 and 69.4 on October 2, 2026 [2][3]. A falling ratio means silver outperformed gold, which fits silver’s 30 percent gain against gold’s 8 percent. The copper-to-gold ratio, copper dollars per pound times 1,000 divided by the gold price, went from 1.27 to 1.56 [1][3]. Some market commentators watch that ratio as a rough gauge of industrial demand against safe-haven demand, though it is an informal rule of thumb, not a law.
The year was not smooth. The deepest fall from a running peak within the twelve months was 13 percent for copper, 51 percent for silver and 25 percent for gold [1][2][3]. All of those drawdowns occurred inside a year that ended higher, a reminder that a one-year percentage change hides the path. Ratios and drawdowns are my calculation from continuous futures closes.
How to read this
- Year-on-year numbers depend on the start date. A different start would give different percentages.
- Futures are not physical metal. Continuous contracts splice months together.
- This is description, not advice.
Prices are daily closes from Yahoo Finance historical data pages for the dates shown.
Questions readers ask
How much did copper rise over the past year?
Copper futures rose 33%, from $4.90 to $6.49 a pound between October 2, 2025 and October 2, 2026 [1].
Did a stronger dollar hold metals back?
Not over this year. The dollar index rose 4.2% while copper, silver and gold all gained [1][2][3][4].
References
- Copper Futures (HG=F) Historical Data, Yahoo Finance — https://finance.yahoo.com/quote/HG%3DF/history/
- Silver Futures (SI=F) Historical Data, Yahoo Finance — https://finance.yahoo.com/quote/SI%3DF/history/
- Gold Futures (GC=F) Historical Data, Yahoo Finance — https://finance.yahoo.com/quote/GC%3DF/history/
- U.S. Dollar Index (DX-Y.NYB) Historical Data, Yahoo Finance — https://finance.yahoo.com/quote/DX-Y.NYB/history/