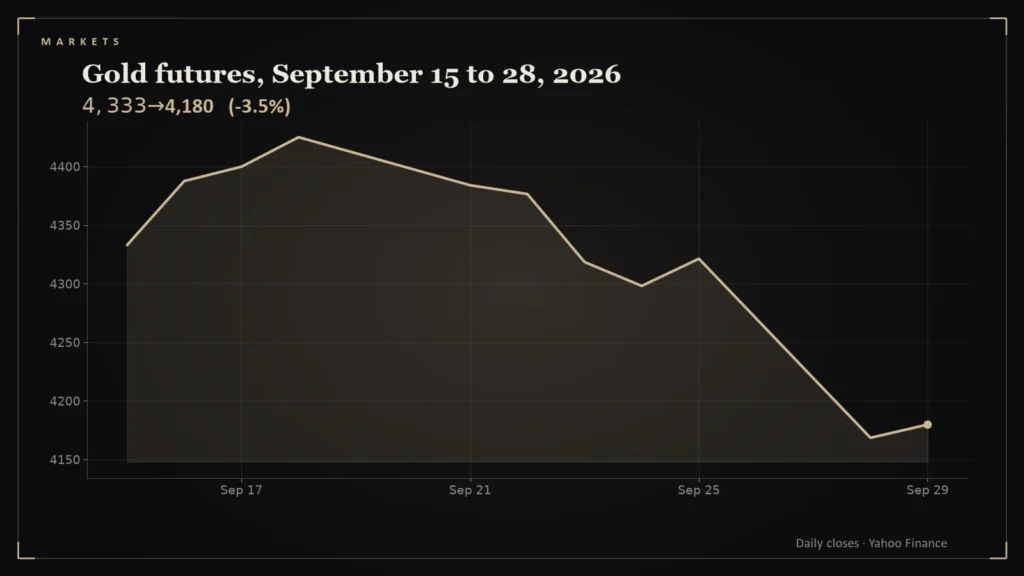
Gold has a reputation as the steady hand of the portfolio, a ship’s anchor in rough water. September 28 was a reminder that anchors can slip: the metal lost 3.54% in one session.
- Gold closed at $4,168.40 on September 28, down 3.54% from $4,321.20 [1].
- In 502 daily changes between October 2024 and September 2026, 9 were a larger fall than that [1].
- The S&P 500 fell 0.77% and the VIX rose from 14.87 to 16.07 the same day [2][3].
- On a $10,000 holding, a 3.54% drop is a $354 loss in a single day.
The day
Gold futures closed at $4,321.20 on Friday, September 25 and $4,168.40 on Monday, September 28, a fall of $152.80 an ounce, or 3.54% [1]. On a $10,000 holding, that is about $354 gone in a day.
How unusual was it?
Using the daily closing series from early October 2024 to the end of September 2026, I counted 502 one-day changes. 9 of them were larger declines than 3.54% [1]. So a drop of this size is uncommon, but this window also contains much larger ones, so it is not unprecedented. One caveat: Yahoo’s continuous futures series splices contracts together, so individual days can reflect contract rolls.
What else moved
The S&P 500 fell 0.77% to 7,683.69 [2]. The VIX rose from 14.87 to 16.07 [3]. The 10-year yield climbed to 5.24% from 5.18% [4]. A day when stocks, gold and bonds all fall together is a day when diversification fails to cushion, which is worth noting for anyone who assumed gold would offset stock losses.
Volatility, not just direction
Gold’s ordinary daily swing in this window is smaller than the headline suggests. The standard deviation of its daily changes since October 2024 is 1.54 percent, so a 3.5 percent fall is about 2.3 standard deviations, unusual but not impossible [1]. Only 9 sessions in the data were worse. What happened in the five sessions after those worse days? Among the 9 that have five later sessions in the series, the average five-day change was +2.1% and 7 of 9 were positive [1]. That is a small sample from an unusually volatile stretch for the metal, so it describes the past without predicting the next week.
The practical point concerns diversification. On September 28 the S&P 500 and gold both fell, and the 10-year yield rose to 5.24% [2][4]. A hedge that works on average can still fail on a given day, which is why risk managers look at correlations over many windows rather than one. All statistics here are my calculation from continuous futures closes, which splice contracts together.
The lesson in proportion
- Safe-haven is a tendency, not a guarantee. Gold fell on a day stocks fell.
- Check your window. The same drop looks mild or extreme depending on the history you compare it with.
- One day is not a trend.
Prices are from Yahoo Finance daily historical data. The count of larger declines comes from the same series.
Questions readers ask
Is a 3.5% one-day drop in gold normal?
It is uncommon: 9 of 502 daily changes in the October 2024 to September 2026 data were larger declines [1].
Did gold protect investors on September 28?
No. Gold fell 3.54% on the same day the S&P 500 fell 0.77% [1][2].
References
- Gold Futures (GC=F) Historical Data, Yahoo Finance — https://finance.yahoo.com/quote/GC%3DF/history/
- S&P 500 (^GSPC) Historical Data, Yahoo Finance — https://finance.yahoo.com/quote/%5EGSPC/history/
- CBOE Volatility Index (^VIX) Historical Data, Yahoo Finance — https://finance.yahoo.com/quote/%5EVIX/history/
- CBOE 10-Year Treasury Yield (^TNX) Historical Data, Yahoo Finance — https://finance.yahoo.com/quote/%5ETNX/history/