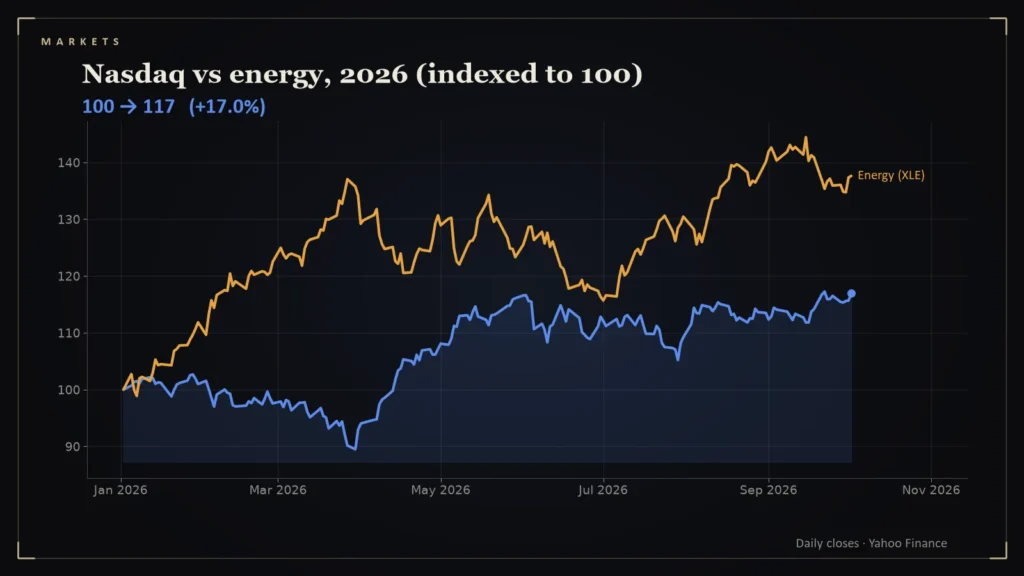
Markets in 2026 have run two stories side by side. One is a war that made oil dearer. The other is an artificial-intelligence build-out that made certain companies richer. Each has its own trade, and the timing of when to be in either one was very different.
- The Energy Select Sector SPDR (XLE) is up about 40.5 percent for 2026, rising from $45.13 on January 7 to a high of $65.93 on September 15 [1].
- Since the March 30 market low, XLE has gained only about 1.4 percent, while the Nasdaq Composite gained about 30.8 percent [1][2].
- The Nasdaq Composite is up about 17.0 percent for the year [2].
- The two sectors responded to opposite pieces of the same event: oil up, rates up [3][4].
Energy: early and then steady
The energy sector ETF XLE began 2026 near $45 and had gained about 40.5 percent by October 2, peaking at $65.93 on September 15 [1]. Most of that gain arrived early. XLE was already near $56 on February 27, the day before the war began, and hit $62.56 on March 27 [1]. After the March 30 stock-market low, it gained only about 1.4 percent [1]. Brent crude topped out at $118.35 on March 31 [3], so the energy equities had largely priced the shock by the time prices peaked.
Tech: late and large
The Nasdaq Composite fell to 20,794.64 on March 30 and closed at 27,190.86 on October 2, a gain of about 30.8 percent from the low and about 17.0 percent for the year [2]. That is the rebound you would expect from a market that had been sold on rate and growth fears and then re-priced on earnings; S&P 500 second-quarter earnings growth was about 50 percent, with 86 percent of companies beating estimates [5].
The common cause, the different channels
The war pushed oil higher, which helped energy producers directly. It also pushed inflation and interest rates higher, which pressures long-duration growth stocks. The 10-year yield rose from 3.96 percent to 5.28 percent between February 27 and October 2 [4]. That tech still rebounded so strongly shows how much the earnings story outweighed the rate story, at least so far.
How tied together were they?
Month by month, the energy fund beat the Nasdaq Composite in 6 of the 10 full months from January to September [1][2] (my calculation from month-end closes). The correlation of their daily changes across 2026 through October 2 was -0.35 [1][2], close to zero, which says the two sectors were driven by different forces on a typical day. Sector funds that move independently are what diversification relies on, and 2026 showed it working in one direction and failing to protect in the other.
The sector gap is not a statement about value. XLE ended the period at 62.82 and the Nasdaq Composite at 27,191, after the energy fund’s early surge and the index’s later one [1][2]. Because the two series move on different calendars, any comparison depends on the start date, and a start in January favors energy while a start at the March low favors technology. That sensitivity is the real lesson of the divergence.
What the divergence teaches
- The same event can help one sector and hurt another within weeks.
- Sector leadership rotates: energy led the first act, tech the second.
- Entering a trade after the news is priced captures the story but not the return; XLE’s gain since March is modest compared to its gain before.
This is analysis, not investment advice.
Questions readers ask
How have energy stocks performed in 2026?
XLE is up about 40.5 percent for the year as of October 2 but only about 1.4 percent since the March 30 market low [1].
How have tech stocks performed since March?
The Nasdaq Composite is up about 30.8 percent from its March 30 low [2].
References
- Energy Select Sector SPDR Fund (XLE) Historical Prices — Yahoo Finance — https://finance.yahoo.com/quote/XLE/history/
- Nasdaq Composite (^IXIC) Historical Prices — Yahoo Finance — https://finance.yahoo.com/quote/%5EIXIC/history/
- Brent Crude Oil (BZ=F) Historical Prices — Yahoo Finance — https://finance.yahoo.com/quote/BZ%3DF/history/
- CBOE 10-Year Treasury Yield (^TNX) Historical Data — Yahoo Finance — https://finance.yahoo.com/quote/%5ETNX/history/
- S&P 500 Earnings Season Update, August 7, 2026 — FactSet — https://insight.factset.com/sp-500-earnings-season-update-august-7-2026