A jobs report arrives on a Friday morning as a single headline number, and by the following quarter the number has usually changed. May’s report is a good case study, because the economy it described has since been re-measured.
- As currently published, May 2026 payrolls rose 63,000 and unemployment was 4.3 percent [1][2].
- Revisions can be large: the September report revised July from +21,000 to −10,000 and August from +162,000 to +133,000 [1].
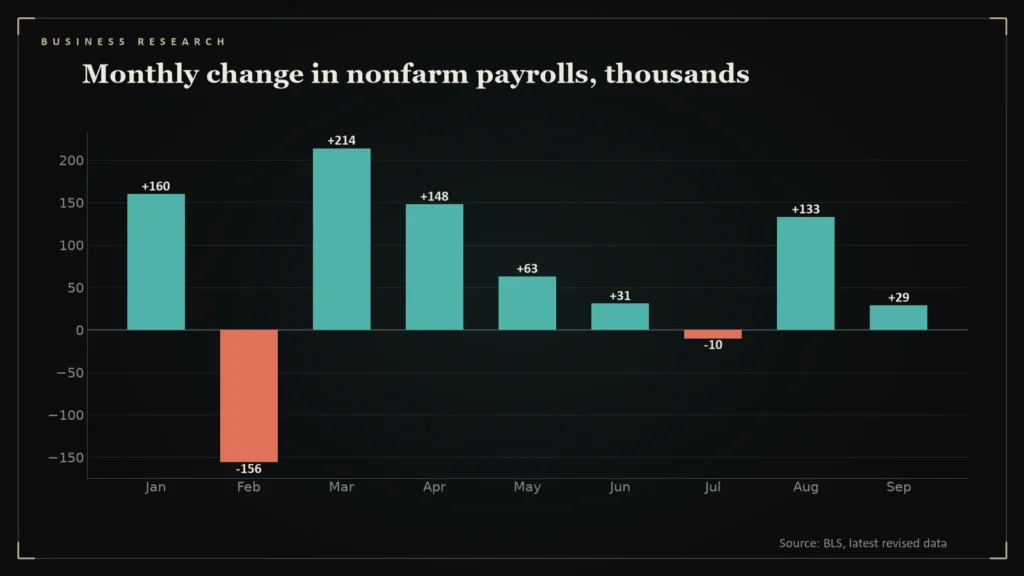
- The payroll level series shows 2026 monthly changes of +160,000 in January, −156,000 in February, +214,000 in March and +148,000 in April before May’s +63,000 [2].
- The honest way to read any jobs number is as a first estimate.
What May looks like now
In the Bureau of Labor Statistics’ current data, nonfarm payrolls rose by about 63,000 in May 2026 and unemployment was 4.3 percent [2]. That sits in the middle of a run: +160,000 in January, a loss of 156,000 in February, +214,000 in March, +148,000 in April, then +63,000 in May [2]. Those are changes computed from the revised employment level, so they may differ from the figures first reported at the time.
How much a first number can move
The September report gives a live example. July was first reported at +21,000 and is now −10,000; August was first +162,000 and is now +133,000. Together the revisions removed 60,000 jobs [1]. A month that looked like a modest gain turned into a modest loss.
Why revisions happen
The monthly report is based on a survey of employers, and not every employer has responded by the time the first estimate is published. As more responses arrive, the estimate is revised, and annual benchmarking against tax records adjusts the whole series. That is normal statistical practice, not a scandal, but it matters for how much weight a single month deserves.
What the revised series shows
The nine monthly changes currently published for 2026 range from -156 thousand to +214 thousand, a spread of 370 thousand jobs within a single year (my calculation from the BLS payroll levels) [2]. The average is 68 thousand and the median 63 thousand, and 4 of the nine months came in below 50 thousand [2]. A single month of such a series says little: the same data produce an average that looks very different from the headline in any one report.
The revisions themselves are a warning label. The September report moved July from +21 thousand to a loss of 10 thousand, a downward change of 31 thousand, and August from +162 thousand to +133 thousand, down 29 thousand [1]. Both revisions reduced the earlier numbers, so a reader who stopped at the first reports would have overstated job growth in those months. The point is not that the first estimate is wrong, but that it comes with a margin that is easy to forget when a headline is all that is read.
How to read a jobs number
- Treat the first print as a first draft, and look at the three-month average.
- Check the two prior months’ revisions in the same report.
- Pair the payroll number with the unemployment rate, which comes from a separate household survey and was 4.3 percent in May and 4.2 percent in September [1][2].
In short, May was not a boom or a bust. It was one frame in a slow-moving film about a labor market adding a few tens of thousands of jobs a month.
Questions readers ask
How many jobs were added in May 2026?
About 63,000 in the BLS’s current data, with unemployment at 4.3 percent [2].
Why are jobs numbers revised?
Because later survey responses and annual benchmarking update the first estimate; July 2026 was revised from +21,000 to −10,000 [1].
References
- The Employment Situation — September 2026 — U.S. Bureau of Labor Statistics — https://www.bls.gov/news.release/empsit.nr0.htm
- BLS Public Data API: Current Employment Statistics, series CES0000000001 — https://api.bls.gov/publicAPI/v1/timeseries/data/CES0000000001