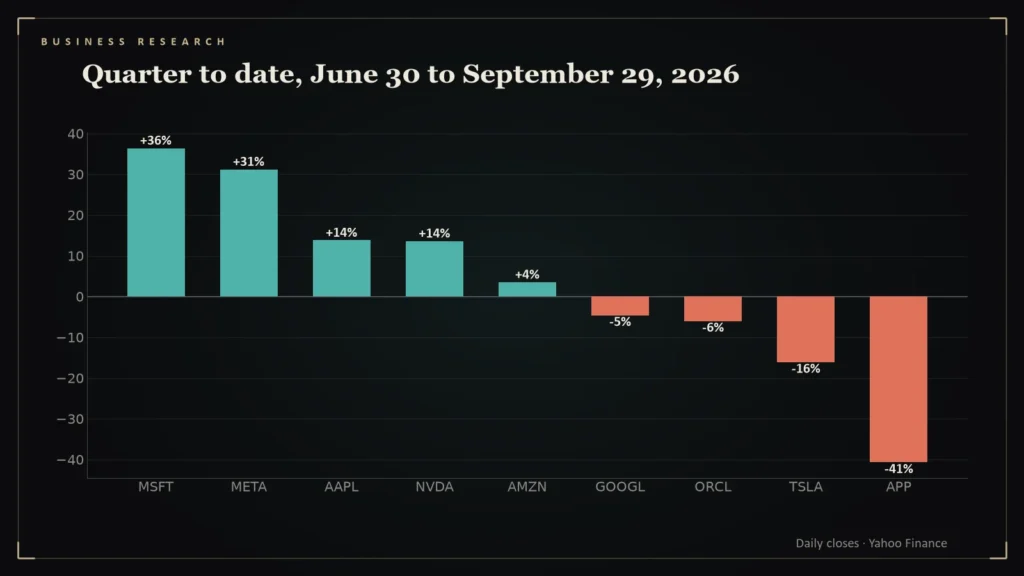
An index is a fruit salad. The average taste tells you little about whether the strawberries are ripe and the pears are mush. The third quarter of 2026 is a good example among the largest technology shares.
- Of nine large technology-linked shares, 5 rose and 4 fell between June 30 and September 29 [1].
- Microsoft led with +36.4%; AppLovin trailed with -40.7% [1].
- The S&P 500 gained 2.3% over the same stretch [2].
- A market index hides how far its biggest members drift apart.
The scoreboard
Between the close of June 30 and the close of September 29, nine large technology-linked shares diverged widely [1]:
| Company | June 30 close ($) | Sept 29 close ($) | Change |
|---|---|---|---|
| Microsoft | 373.02 | 508.96 | +36.4% |
| Meta Platforms | 563.29 | 738.79 | +31.2% |
| Apple | 289.36 | 329.40 | +13.8% |
| Nvidia | 200.09 | 227.21 | +13.6% |
| Amazon | 238.34 | 246.67 | +3.5% |
| Alphabet | 357.37 | 340.92 | -4.6% |
| Oracle | 146.55 | 137.79 | -6.0% |
| Tesla | 420.60 | 352.84 | -16.1% |
| AppLovin | 515.23 | 305.66 | -40.7% |
For comparison, the S&P 500 rose 2.3% over the same period [2].
The spread
The gap between the best performer (Microsoft, +36.4%) and the worst (AppLovin, -40.7%) is 77 percentage points. An investor who owned all nine in equal amounts earned roughly 3.5% on average, but no actual holder of one share earned the average.
Who beat the index?
Only 5 of the nine shares beat the S&P 500’s 2.3% gain over the same dates: Microsoft, Meta Platforms, Apple, Nvidia, Amazon [2]. The median return of the group was +3.5%, below the index, even though the simple average of +3.5% sits above it because a few large gains pull it up [1]. That gap between average and median is a standard sign of a lopsided distribution, and it is the reason a single headline number can mislead.
Split the group by direction and the contrast is stark. The 5 gainers averaged +19.7%, while the 4 decliners averaged -16.8% [1]. An investor holding only the best three would have earned +27.1% on average, and one holding only the worst three -20.9%. These are my calculations from closing prices between June 30 and September 29 and ignore dividends, fees and taxes; they illustrate dispersion rather than recommend any holding.
What dispersion implies
- Concentration is a choice. Owning one or two of these names produced very different outcomes than owning the group.
- Index returns mask internal drift. The S&P 500’s 2.3% is a blend.
- Quarter-to-date is a short window. Leaders and laggards change.
Prices are daily closes from Yahoo Finance historical data. These are not recommendations; the table is a description of past prices only.
Questions readers ask
Did all the big technology shares rise in the third quarter of 2026?
No. Between June 30 and September 29, 5 of nine rose and 4 fell [1].
Which large technology share did best in the quarter so far?
Of the nine reviewed, Microsoft led with +36.4% from June 30 to September 29 [1].
References
- Yahoo Finance Historical Data, Nvidia, Microsoft, Apple, Amazon, Alphabet, Meta, Oracle, Tesla and AppLovin — https://finance.yahoo.com/quote/NVDA/history/
- S&P 500 (^GSPC) Historical Data, Yahoo Finance — https://finance.yahoo.com/quote/%5EGSPC/history/