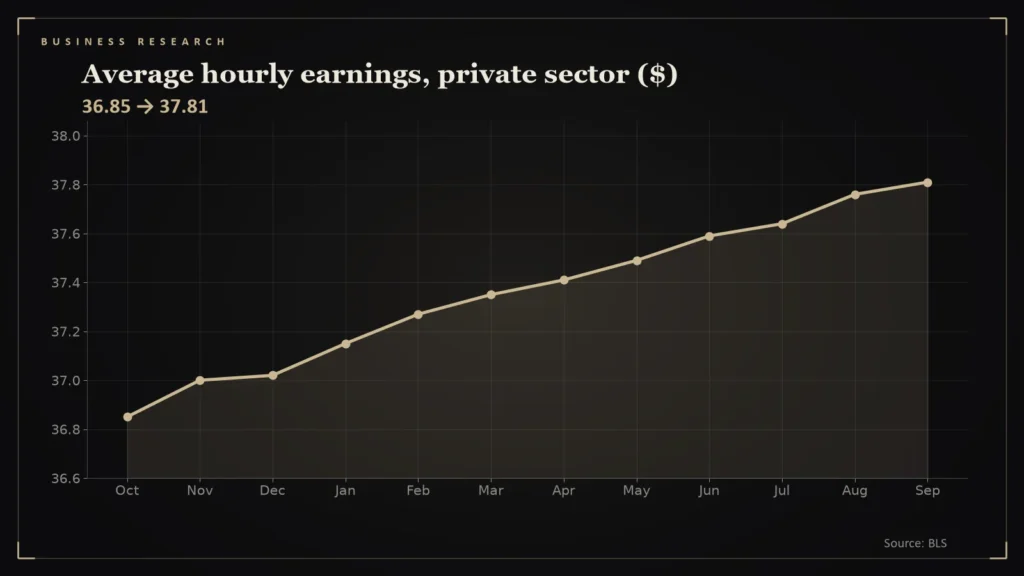
Most people experience the economy through one comparison: does my paycheck buy more or less than it did a year ago? In 2026 the answer flipped in the spring.
- In January and February 2026, hourly earnings growth (3.7 percent) beat CPI inflation (about 2.4 percent) by roughly 1.2 points (my calculation from BLS data) [1][2].
- From April, inflation passed wage growth: in May hourly earnings grew 3.3 percent against CPI at 4.3 percent, a real change near −0.9 percent [1][2].
- By August, wages were up 3.1 percent against inflation of 3.4 percent, a real change of about −0.3 percent [1][2].
- In 2025 wage growth ran 3.7 to 4.2 percent against inflation of 2.3 to 3.0 percent [1][2].
The method
Real wage growth is wage growth adjusted for inflation. Using the Bureau of Labor Statistics’ average hourly earnings of private-sector workers and its non-seasonally-adjusted CPI, the 12-month change in each gives a rough read on how purchasing power moved [1][2]. The comparison is imperfect, because average earnings reflect job mix as well as pay, but it is the standard quick check.
The monthly numbers
| Month (2026) | Wage growth | CPI inflation | Real change |
|---|---|---|---|
| January | 3.7% | 2.4% | +1.2% |
| February | 3.7% | 2.4% | +1.3% |
| March | 3.4% | 3.3% | +0.2% |
| April | 3.6% | 3.8% | −0.2% |
| May | 3.3% | 4.3% | −0.9% |
| June | 3.4% | 3.5% | −0.1% |
| July | 3.2% | 3.4% | −0.2% |
| August | 3.1% | 3.4% | −0.3% |
Source: BLS data, my calculations [1][2].
What changed
Two things. Wage growth slowed from about 3.7 percent to about 3.1 percent as hiring cooled and payroll growth fell to a few tens of thousands a month [3]. And inflation rose as energy prices surged after the war began on February 28, with gasoline up 27.4 percent by August [4]. The crossover came in April.
The larger context
In 2025, wage growth ran between 3.7 and 4.2 percent while inflation stayed between roughly 2.3 and 3.0 percent, giving workers real gains most of the year [1][2]. The 2026 reversal is therefore a break from the previous pattern, not a continuation.
Last year for comparison
Setting 2026 against 2025 shows how unusual the squeeze is. Using the same method for months of 2025 where both series exist (October 2025 was not published):
| Month | Earnings, 12-month | CPI, 12-month | Gap (points) |
|---|---|---|---|
| Jan 2025 | 4.0% | 3.0% | +1.0 |
| Feb 2025 | 4.1% | 2.8% | +1.3 |
| Mar 2025 | 4.2% | 2.4% | +1.8 |
| Apr 2025 | 3.9% | 2.3% | +1.6 |
| May 2025 | 4.0% | 2.4% | +1.6 |
| Jun 2025 | 3.9% | 2.7% | +1.2 |
| Jul 2025 | 4.0% | 2.7% | +1.3 |
| Aug 2025 | 4.0% | 2.9% | +1.1 |
| Sep 2025 | 3.8% | 3.0% | +0.8 |
| Nov 2025 | 3.9% | 2.7% | +1.2 |
| Dec 2025 | 3.7% | 2.7% | +1.0 |
In every month shown, wage growth ran ahead of inflation in 2025, which is the background to the January and February 2026 gaps and to the contrast with the spring [1][2]. The turn came as energy prices rose after the war began, and the mood data show that households noticed [5]. The lesson from the pair of tables is that real pay depends as much on the price side as on the pay side.
Why it matters
Real wages are the link between jobs and spending. When they turn negative, households cover the gap by saving less, borrowing more or buying less. That is one reason consumer sentiment has fallen to a record low even while the unemployment rate stayed near 4.2 percent [3][5]. This is analysis, not investment advice.
Questions readers ask
Are real wages falling in 2026?
Slightly: by my calculation from BLS data, hourly earnings growth fell behind CPI inflation from April, reaching about −0.3 percent in August [1][2].
How is real wage growth calculated?
By comparing the 12-month change in wages with the 12-month change in consumer prices.
References
- BLS Public Data API: Average Hourly Earnings, series CES0500000003 — https://api.bls.gov/publicAPI/v1/timeseries/data/CES0500000003
- BLS Public Data API: Consumer Price Index, series CUUR0000SA0 — https://api.bls.gov/publicAPI/v1/timeseries/data/CUUR0000SA0
- The Employment Situation — September 2026 — U.S. Bureau of Labor Statistics — https://www.bls.gov/news.release/empsit.nr0.htm
- Consumer Price Index — August 2026 — U.S. Bureau of Labor Statistics — https://www.bls.gov/news.release/cpi.nr0.htm
- Consumer sentiment falls again in September — Advisor Perspectives — https://www.advisorperspectives.com/dshort/updates/2026/09/25/consumer-sentiment-falls-again-in-september