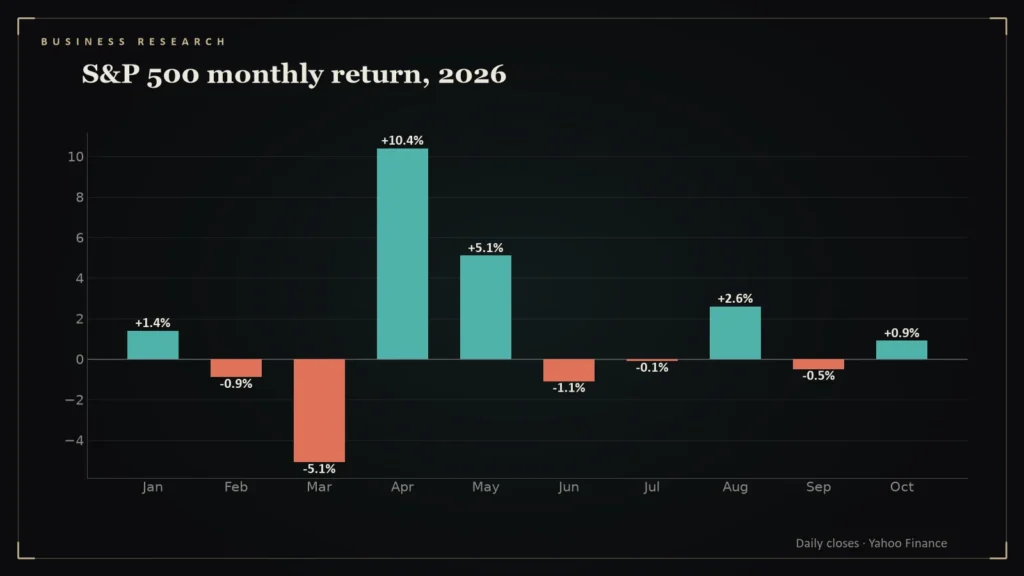
Annual returns hide timing. The 2026 S&P 500 year, at about +12.8 percent so far, is really the story of one month.
- The S&P 500’s worst month of 2026 was March (−5.1 percent) and its best was April (+10.4 percent), by month-end closes [1].
- After April’s gain it added 5.1 percent in May, then was roughly flat from June through September [1].
- Through October 2 the index was up about 12.8 percent for the year, at 7,722.72 [1].
- A single month, April, accounts for most of the year’s gain.
The monthly table
| Month | Month-end close | Monthly change |
|---|---|---|
| January | 6,939.0 | +1.4% |
| February | 6,878.9 | −0.9% |
| March | 6,528.5 | −5.1% |
| April | 7,209.0 | +10.4% |
| May | 7,580.1 | +5.1% |
| June | 7,499.4 | −1.1% |
| July | 7,489.7 | −0.1% |
| August | 7,686.1 | +2.6% |
| September | 7,651.5 | −0.5% |
Source: Yahoo Finance month-end closes, my calculations [1]. The index closed at 7,722.72 on October 2, up about 0.9 percent for October so far.
What the table shows
The index lost 5.1 percent in March, when oil spiked and the VIX hit 31.05, and gained 10.4 percent in April and 5.1 percent in May, together about 16 percent [1][2]. Since the end of May the market has moved sideways: June through September combined was roughly +1.0 percent [1]. A reader who looked only at the first two months would have called 2026 a flat year.
Why timing matters
The gap between a diversified investor who stayed invested and one who waited out March shows up in a single month. This is the standard case for not trying to time markets: the best months tend to follow the worst, and missing a few can erase most of a year’s return. But the historical pattern does not guarantee anything about the next fall.
The table itself
The monthly returns, from month-end closes (the October figure covers only October 1 and 2) [1]:
| Month | S&P 500 |
|---|---|
| Jan | +1.4% |
| Feb | -0.9% |
| Mar | -5.1% |
| Apr | +10.4% |
| May | +5.1% |
| Jun | -1.1% |
| Jul | -0.1% |
| Aug | +2.6% |
| Sep | -0.5% |
| Oct | +0.9% |
The index rose in 5 of the 10 periods in the table. A single strong month, April, accounted for most of the year-to-date gain, and a reader considering a lump-sum entry at the start of the year or in April would have had very different results. The point of showing the table is not to time the market but to recognize how uneven returns are within a year, with the volatility and earnings figures covered elsewhere in this series [2][3].
What the sideways summer says
Since May, strong earnings (about 50 percent growth in the second quarter, 32 percent excluding two outliers [3]) have been offset by rising yields and higher oil. The 10-year yield rose from about 4.4 percent in June to 5.28 percent in October [4]. Markets have absorbed good and bad news without a decisive direction. This is analysis, not investment advice.
Questions readers ask
What was the S&P 500's best month in 2026?
April, at +10.4 percent by month-end close, according to Yahoo Finance data [1].
What was its worst month?
March, at −5.1 percent [1].
References
- S&P 500 (^GSPC) Historical Prices — Yahoo Finance — https://finance.yahoo.com/quote/%5EGSPC/history/
- CBOE Volatility Index (^VIX) Historical Prices — Yahoo Finance — https://finance.yahoo.com/quote/%5EVIX/history/
- S&P 500 Earnings Season Update, August 7, 2026 — FactSet — https://insight.factset.com/sp-500-earnings-season-update-august-7-2026
- CBOE 10-Year Treasury Yield (^TNX) Historical Data — Yahoo Finance — https://finance.yahoo.com/quote/%5ETNX/history/