Why Two Polls on the Same War Can Both Be Right
Quinnipiac said 53% opposed, Fox said 50-50, Gallup said 34% approved. The gaps come from question wording, sample and timing. How to compare polls fairly.
One war, three numbers: 53 percent opposed, a 50-50 split, 34 percent approving. Someone is wrong, a skeptic says. Almost certainly no one is. They measured different things.
- Quinnipiac surveyed registered voters and asked about support for U.S. military action, finding 53 percent opposed and 40 percent in favor [1].
- A Fox News poll reported an even 50-50 approve/disapprove split [1], while Gallup’s June 1-15, 2026 poll found 34 percent approved of the action [2].
- Marist’s March 2026 poll used 1,591 adults with a margin of error of plus or minus 2.8 points [3]; a March 2026 online survey with a non-probability sample, like the GPAHE poll, carries different caveats [4].
- Compare polls only when sample, wording and timing are close.
1. The question
Quinnipiac asked registered voters whether they supported or opposed U.S. military action, and got 53 percent opposed and 40 percent in favor [1]. Fox News framed it as approval and disapproval and reported an even split [1]. Gallup asked whether respondents approved of the military action being taken, and found 34 percent did [2]. “Support,” “approve” and “oppose” are cousins, not twins; each nudges people toward slightly different answers, and each has its own undecided column.
2. The sample
Registered voters are not the same population as all adults. Quinnipiac sampled registered voters [1]; Marist surveyed 1,591 national adults with a margin of error of plus or minus 2.8 points [3]; the GPAHE survey used an online, non-probability sample of 1,552 adults with demographic quotas, which means its margin of error cannot be computed the same way [4]. A probability sample lets you say how far off the result is likely to be. A quota sample cannot.
3. The date
Opinion on a war is a moving target. Quinnipiac’s survey was taken the weekend before March 10, early in the conflict [1]. Gallup’s was June 1 to 15 [2]. Three months of casualties, headlines and gas prices lie between them.
The arithmetic of a margin of error
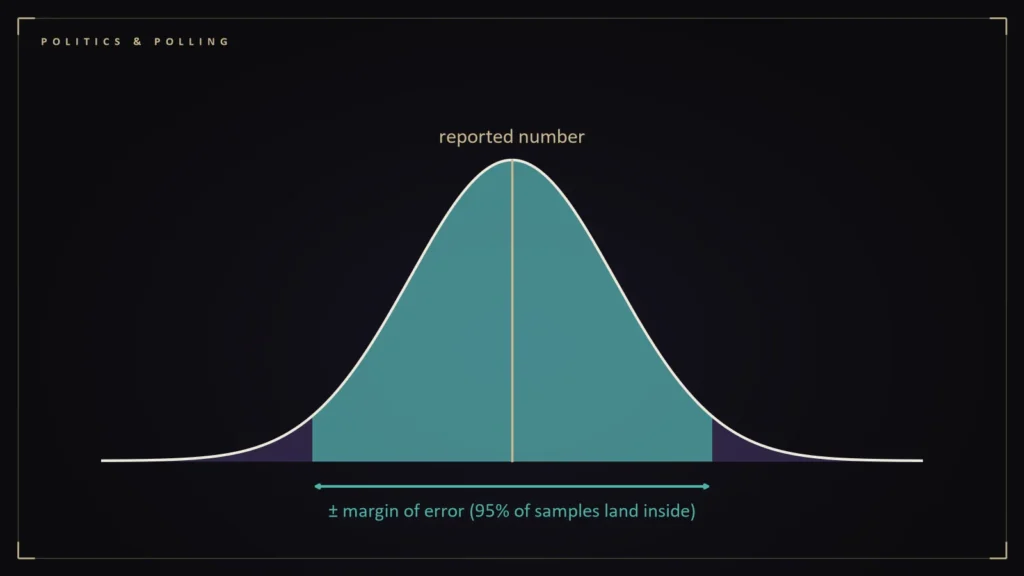
A rule of thumb helps check any poll. For a simple random sample, the 95 percent margin of error in percentage points is roughly 98 divided by the square root of the sample size. For 1,591 adults that gives about 2.5 points, and for 1,000 about 3.1. Marist reported plus or minus 2.8 points for its 1,591-adult poll [3], a little wider than the simple formula, which is normal when pollsters adjust their data to match the population (the adjustment is called a design effect, and it widens the margin).
Two more cautions follow. The margin applies to each percentage separately, so the gap between two polls’ results is uncertain by more than either margin alone, roughly 1.4 times as much for two similar samples. And a margin of error only makes sense for probability samples; an online survey that people opted into, like the one in the fourth reference, does not have a true margin of error in the same sense [4]. When two polls on the same war disagree by a few points, sampling noise is often a sufficient explanation before anyone has to invoke bias.
A checklist before you compare
- Same population (adults, registered voters or likely voters)?
- Same wording, and does it offer a middle or “not sure” option?
- Same dates, within a couple of weeks?
- Probability sample, with a stated margin of error?
If three of the four answers are yes, compare away. If not, treat each poll as its own photograph of its own moment.
Questions readers ask
Why do polls on the same issue give different results?
Because they differ in question wording, who was surveyed, and when; a margin of error also applies only to probability samples [1][2][3][4].
What is a non-probability sample?
A sample, often an online panel with demographic quotas, that is not randomly selected from the whole population, so a standard margin of error cannot be calculated [4].
References
- Polls show what Americans think about the war in Iran — PBS NewsHour — https://www.pbs.org/newshour/politics/polls-show-what-americans-think-about-the-war-in-iran.
- Poll reveals how public support for Iran war compares to other U.S. conflicts — Fox 5 NY, reporting Gallup — https://www.fox5ny.com/news/poll-reveals-how-public-support-iran-war-compares-other-us-conflicts
- Election Security, March 2026 — NPR/PBS News/Marist Poll — https://maristpoll.marist.edu/polls/election-security-march-2026/
- Americans Have Significant Fears About Voting: Survey 2026 — Global Project Against Hate and Extremism — https://globalextremism.org/post/americans-have-significant-fears-about-voting-survey-2026/